效用函数
Although preferences are the conventional foundation of microeconomics, it is often convenient to represent preferences with a utility function and analyze human behavior indirectly with utility functions. Let X be the consumption set, the set of all mutually-exclusive baskets the consumer could conceivably consume. The consumer’s utility function {\displaystyle u\colon X\to \mathbb {R} } u\colon X\to \R ranks each package in the consumption set. If the consumer strictly prefers x to y or is indifferent between them, then {\displaystyle u(x)\geq u(y)} u(x)\geq u(y).
For example, suppose a consumer’s consumption set is X = {nothing, 1 apple,1 orange, 1 apple and 1 orange, 2 apples, 2 oranges}, and its utility function is u(nothing) = 0, u(1 apple) = 1, u(1 orange) = 2, u(1 apple and 1 orange) = 4, u(2 apples) = 2 and u(2 oranges) = 3. Then this consumer prefers 1 orange to 1 apple, but prefers one of each to 2 oranges.
A utility function {\displaystyle u\colon X\to \mathbb {R} } u\colon X\to \R represents a preference relation {\displaystyle \preceq } \preceq on X iff for every {\displaystyle x,y\in X} x, y \in X, {\displaystyle u(x)\leq u(y)} u(x)\leq u(y) implies {\displaystyle x\preceq y} x\preceq y. If u represents {\displaystyle \preceq } \preceq , then this implies {\displaystyle \preceq } \preceq is complete and transitive, and hence rational.
一个效用函数,如果u(x)>u(y)==>x>y
例题
…
边际效用递减
边际效用递减,是指在一定时间内,在其他商品的消费数量保持不变的条件下,当一个人连续消费某种物品时,随着所消费的该物品的数量增加,其总效用 (total utility) 虽然相应增加,但物品的边际效用 (marginal utility,即每消费一个单位的该物品,其所带来的效用的增加量) 有递减的趋势。
在机器学习中,我们在调参数时,某个参数调大,如果带来的正向作用,不如负向作用大时,就没必要使劲调节了。比如正向作用是准确率,负向作用是拒绝率。
在工作过程中,有些高大上的工作就是花精力,但是产出没那么快,也可能没什么产出,产出的价值也没那么多的,作为老板其实蛮关心这方面的东西。
应用
在推荐系统中,还可以做基于效用的推荐,给每个用户弄一个效用函数。
在机器学习模型落地时,在不修改模型,可以修改模型产出的一些结果,让模型更加可用。
即可以理解为模型的校正,也可以理解为模型的部分落地规则。模型的校正公式可以经验生成,可以用参数估计或数据拟合来生成。
UtilityFunction@Mathematica Machine Learning
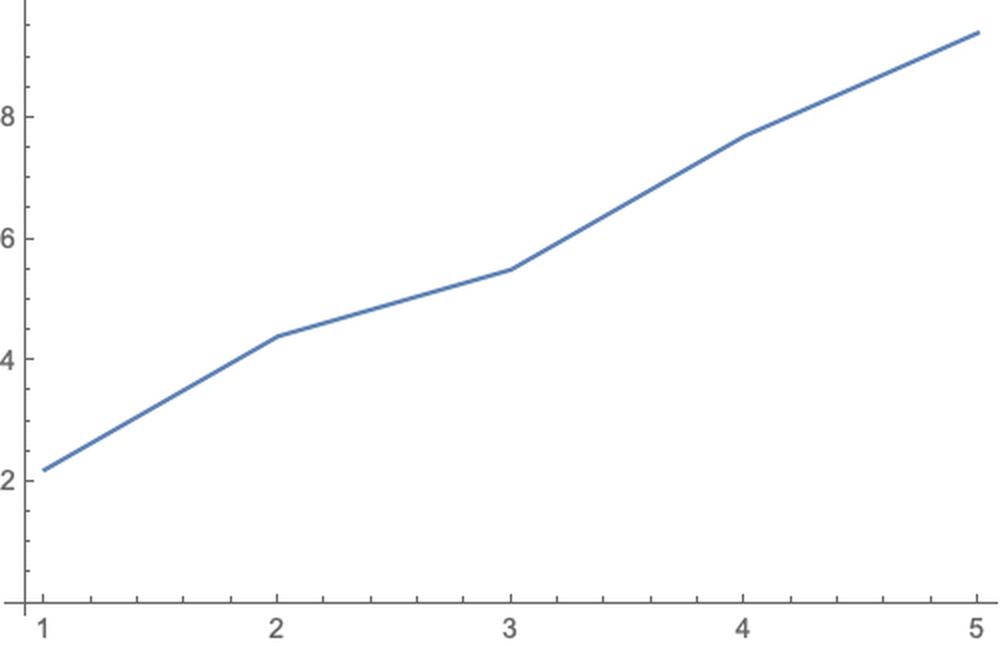
trainingset = {1 -> 2.2, 2 -> 4.4, 3 -> 5.5, 4 -> 7.7, 5 -> 9.4};ListPlot[list = List @@@ trainingset, Joined -> True]

p = Predict[trainingset]

Visualize the probability density for a given example:
example = 4;pdf = PDF[p[example, "Distribution"]]

Plot[pdf[x], {x, 5, 10}, PlotRange -> All]

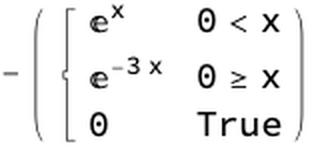
utility[a_, p_] := -Piecewise[{{Exp[p - a], a < p}, {Exp[2*(a - p)], a >= p}}]
Use this utility to predict the example:
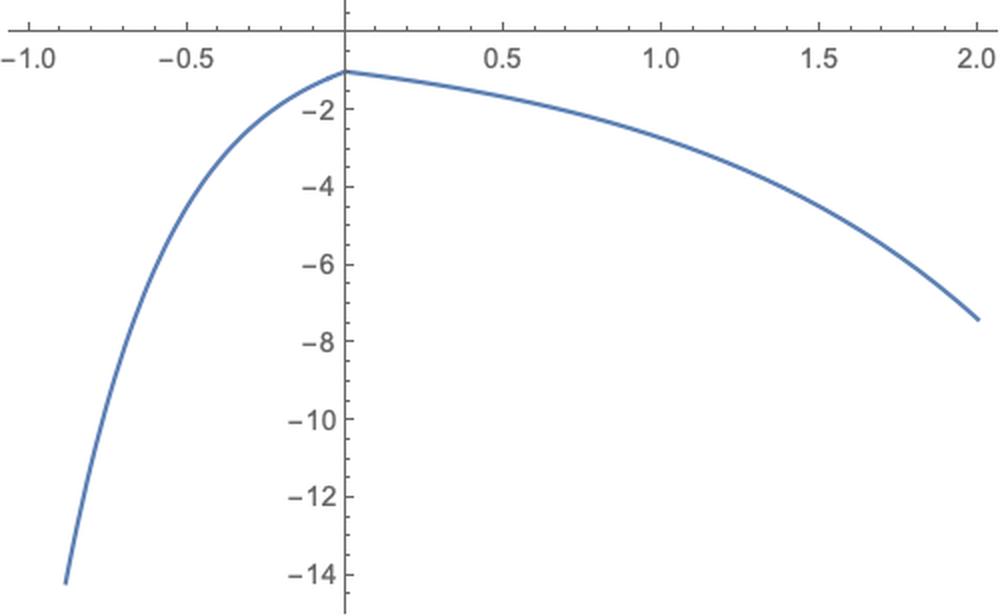
f = utility[0, x]

Plot[f, {x, -1, 2}]

效用函数:假如用户对于修正值的偏好是100%,
v1 = p@4
4.90545
v2 = p[4, UtilityFunction -> utility]
5.447
预测的分布是不变的,但是经过效用函数,把预测结果改成了5.447,那么问题来了,这个东西是怎么计算出来的?用了哪些数据?
utility[v1, v2]
-1.71865
v1a = p[0]
0.861404
v1b = p[0, UtilityFunction -> utility]
1.40295
utility[v1a, v1b]
-1.71865
Table[utility[v1, v2 + i], {i, -3, 3}]
{-1596.19,-79.4698,-3.95657,-1.71865,-4.67178,-12.6992,-34.5201}
所以效用函数的求解时可能用了优化算法或解方法操作@mathematica,参考另一篇Title为UtilityFunction的,跟mathematica有关丢在那一篇里,这一篇讲通用一点的效用函数,这里就不展开了。
<< "/Users/hypergroups/Nutstore/Wolfram \Mathematica/DeployProjects/MyMarkDown/MyMarkDown.wl"Notebook2Markdown[EvaluationNotebook[], "dirOutput" -> NotebookDirectory[], "title" -> "functions_about_utility", ImagePrefix -> "https://raw.githubusercontent.com/HyperGroups/Mathematica/master/\YuQue/mathematica/MachineLearningInAction/utility_function"]

