pyecharts 能够帮助你快速实现数据可视化。
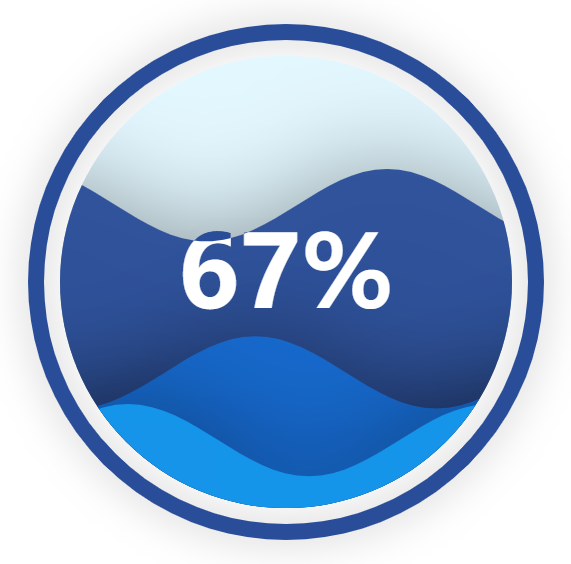
效果大致如下:
from pyecharts import options as optsfrom pyecharts.charts import Liquid, Pagefrom pyecharts.globals import SymbolTypeimport osdef liquid() -> Liquid:c = (Liquid().add("lq", [0.67, 0.30, 0.15]).set_global_opts(title_opts=opts.TitleOpts(title="Liquid")))return cliquid().render('liquid.html')os.system("open liquid.html")
pyecharts 还有很多玩法,你可以下载下面的示例程序来进一步体验。
pyecharts绘图.rar

