分图
import matplotlib.pyplot as pltfig = plt.figure()plt.subplot(2,2,1) ## row column number 2行2列第一张图plt.plot([0,1],[0,1])plt.subplot(2,2,2) ## row column number 2行2列第2张图plt.plot([0,1],[0,2])plt.subplot(2,2,3) ## row column number 2行2列第3张图plt.plot([0,1],[0,3])plt.subplot(2,2,4) ## row column number 2行2列第4张图plt.plot([0,1],[0,4])plt.show()
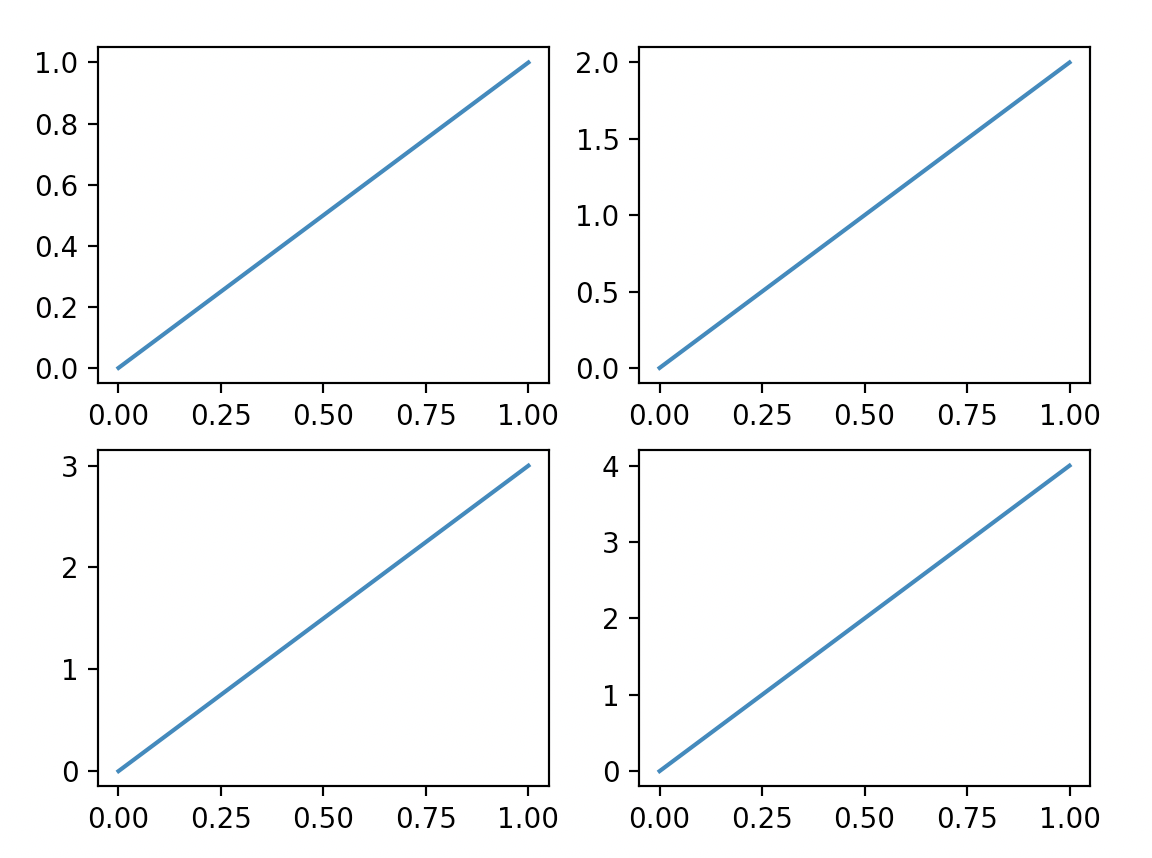
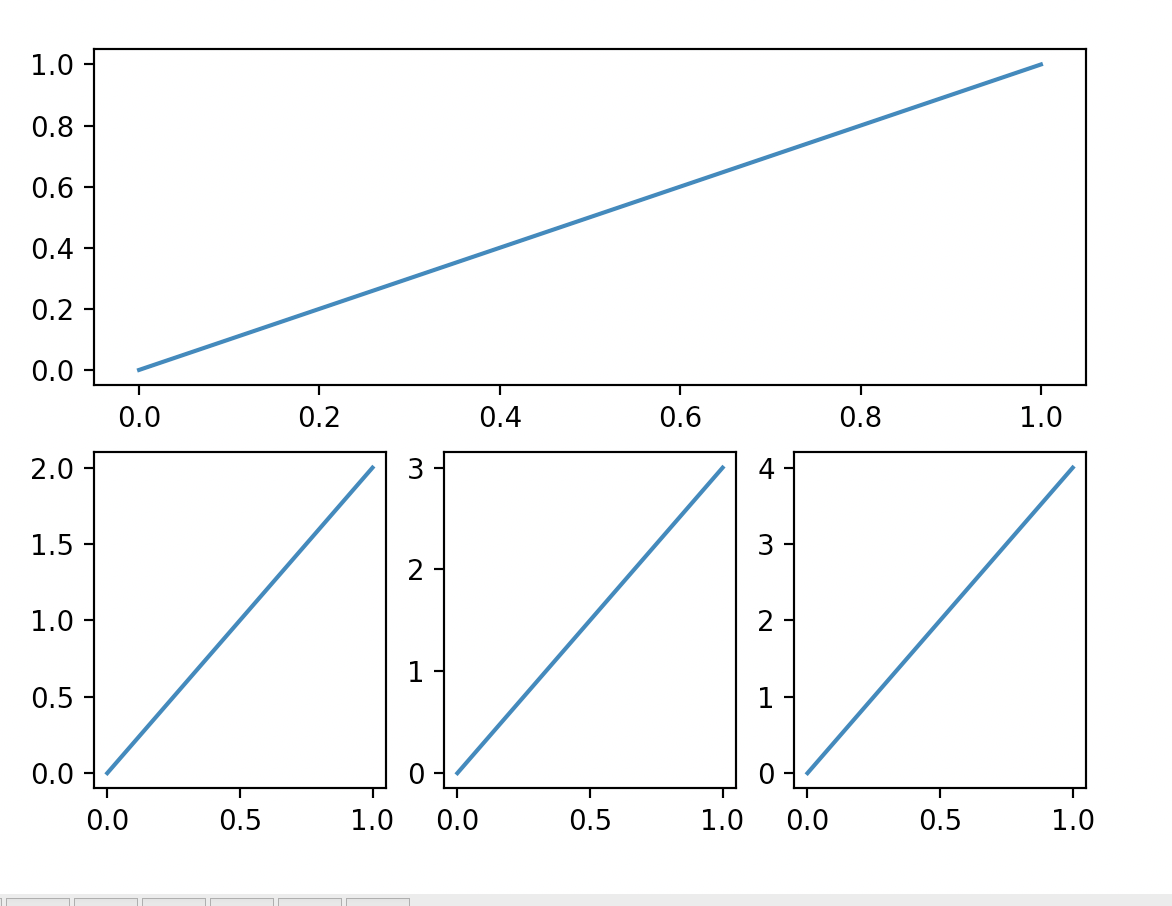
fig = plt.figure()plt.subplot(2,1,1) ## row column number 2行1列第一张图(可以理解为1张图占3张图的地方)plt.plot([0,1],[0,1])plt.subplot(2,3,4) ## row column number 2行3列第1张图,注意编号从4开始plt.plot([0,1],[0,2])plt.subplot(2,3,5) ## row column number 2行3列第2张图plt.plot([0,1],[0,3])plt.subplot(2,3,6) ## row column number 2行3列第3张图plt.plot([0,1],[0,4])
分格图
## method 1 : subplot2grid##########################plt.figure()ax1 = plt.subplot2grid((3,3),(0,0),colspan=3,rowspan=1) ## (3,3)行列(0,0)起点 c## colspan 列跨度 row行跨度ax1.plot([1,2],[1,2])ax1.set_title('ax1_title')ax2 = plt.subplot2grid((3,3),(1,0),colspan=2,rowspan=1) ## 起点,第2行ax3 = plt.subplot2grid((3,3),(1,2),colspan=1,rowspan=2)ax4 = plt.subplot2grid((3,3),(2,0),colspan=1,rowspan=1)ax5 = plt.subplot2grid((3,3),(2,1),colspan=1,rowspan=1)
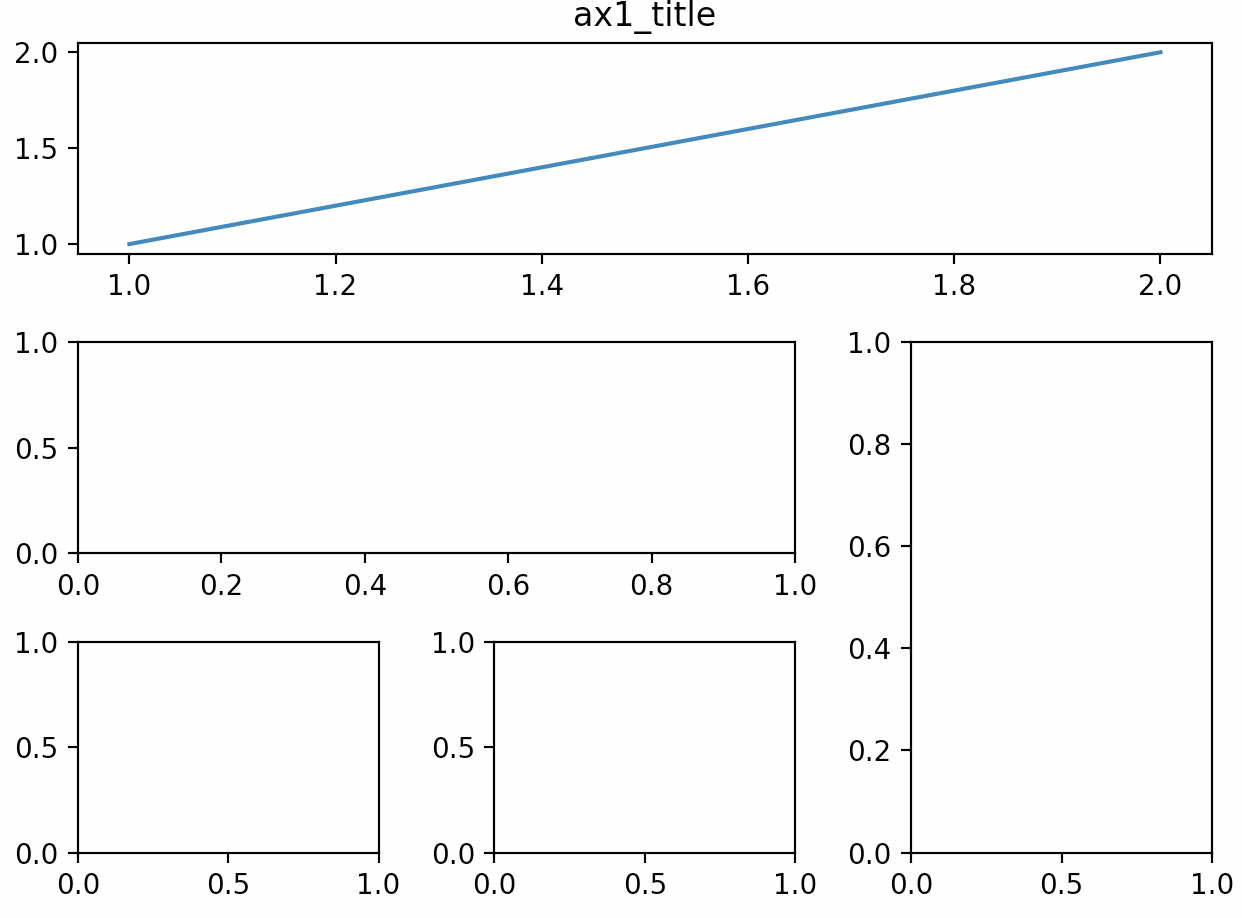
keypoint:找到各个小图的起点坐标,即左上顶点
第二种方法:gridspec
plt.figure()gs = gridspec.GridSpec(3,3)ax1 = plt.subplot(gs[0,:])ax2 = plt.subplot(gs[1,:2])ax3 = plt.subplot(gs[1:,2])ax4 = plt.subplot(gs[2,0])ax5 = plt.subplot(gs[2,1])
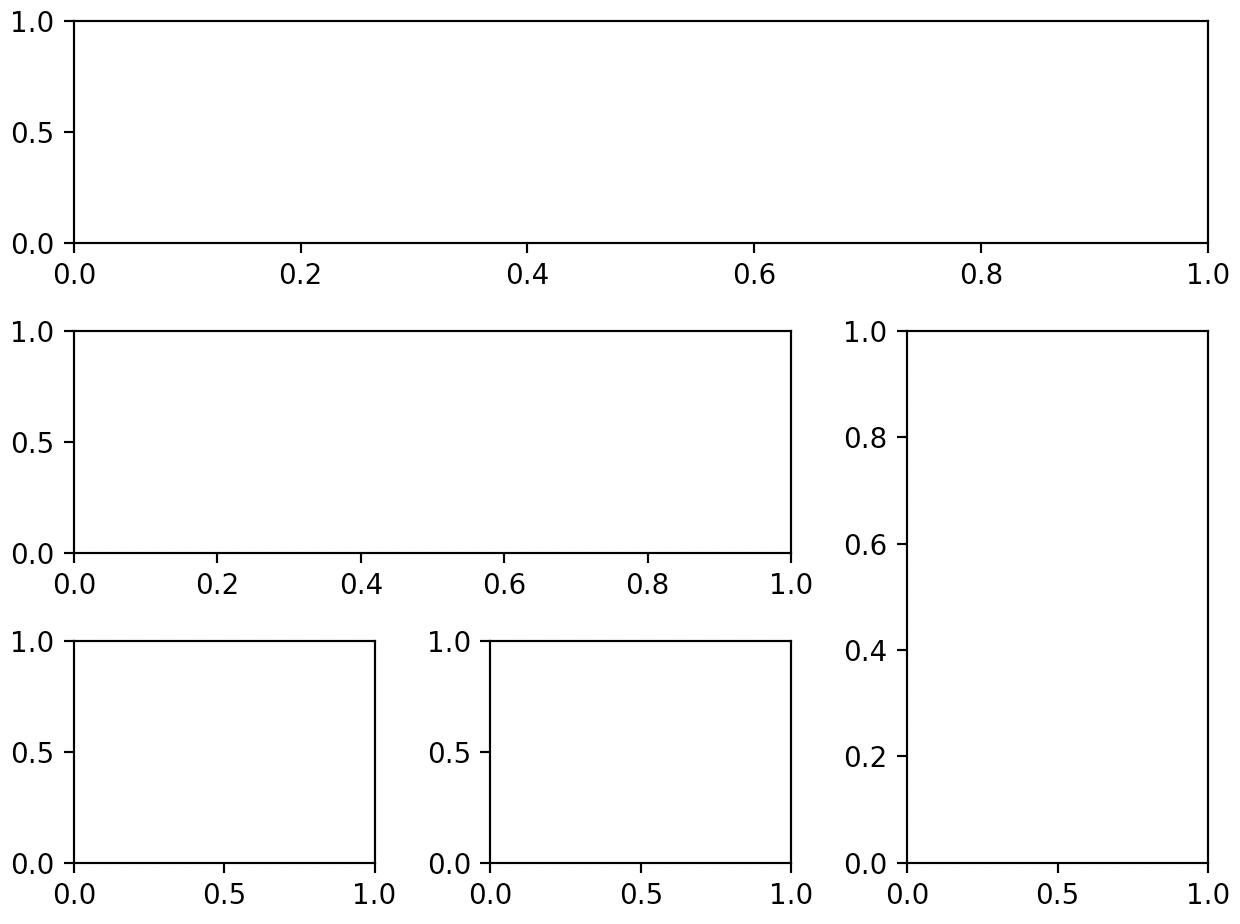
核心思想也是一样,都是顶点坐标和跨度,不过用slice的方法表示
第三种 subplots
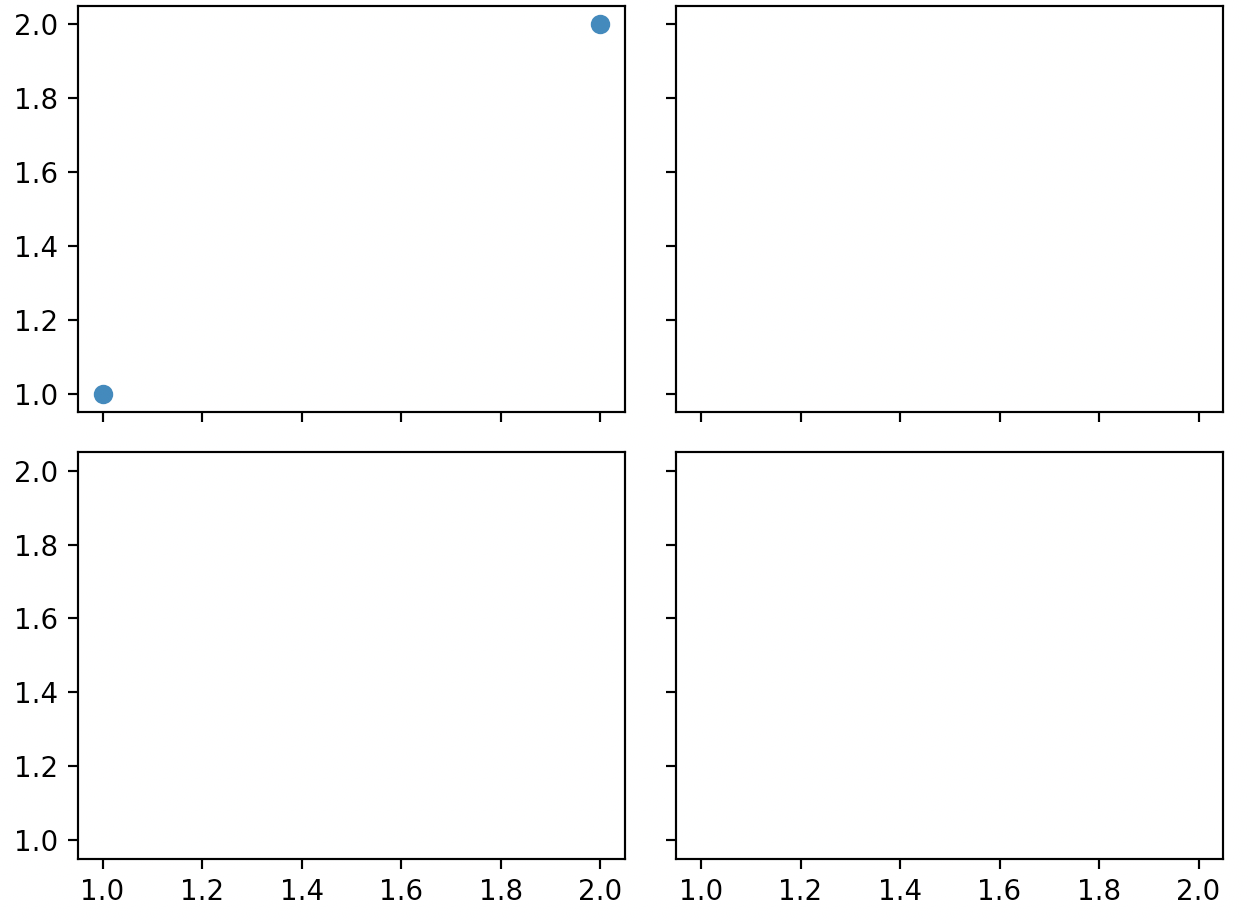
f,((ax11,ax12),(ax21,ax22))=plt.subplots(2,2,sharex=True,sharey=True) ## 共享x、y轴## 分别给f传入(第一行),(第二行)ax11.scatter([1,2],[1,2])
图中图
left,bottom,width,height = 0.1,0.1,0.8,0.8ax1 = fig.add_axes([left,bottom,width,height]) ## 设定大图的框架ax1.plot(x,y,'r')ax1.set_xlabel('x')ax1.set_ylabel('y')ax1.set_title('title')left,bottom,width,height = 0.2,0.6,0.25,0.25ax2 = fig.add_axes([left,bottom,width,height]) ## 设定大图的框架ax2.plot(x,y,'b')ax2.set_xlabel('x')ax2.set_ylabel('y')ax2.set_title('inside_1')plt.axes([.6,0.2,0.25,0.25])plt.plot(y[::-1],x,'g')plt.xlabel('x')plt.ylabel('y')plt.title('inside_2')
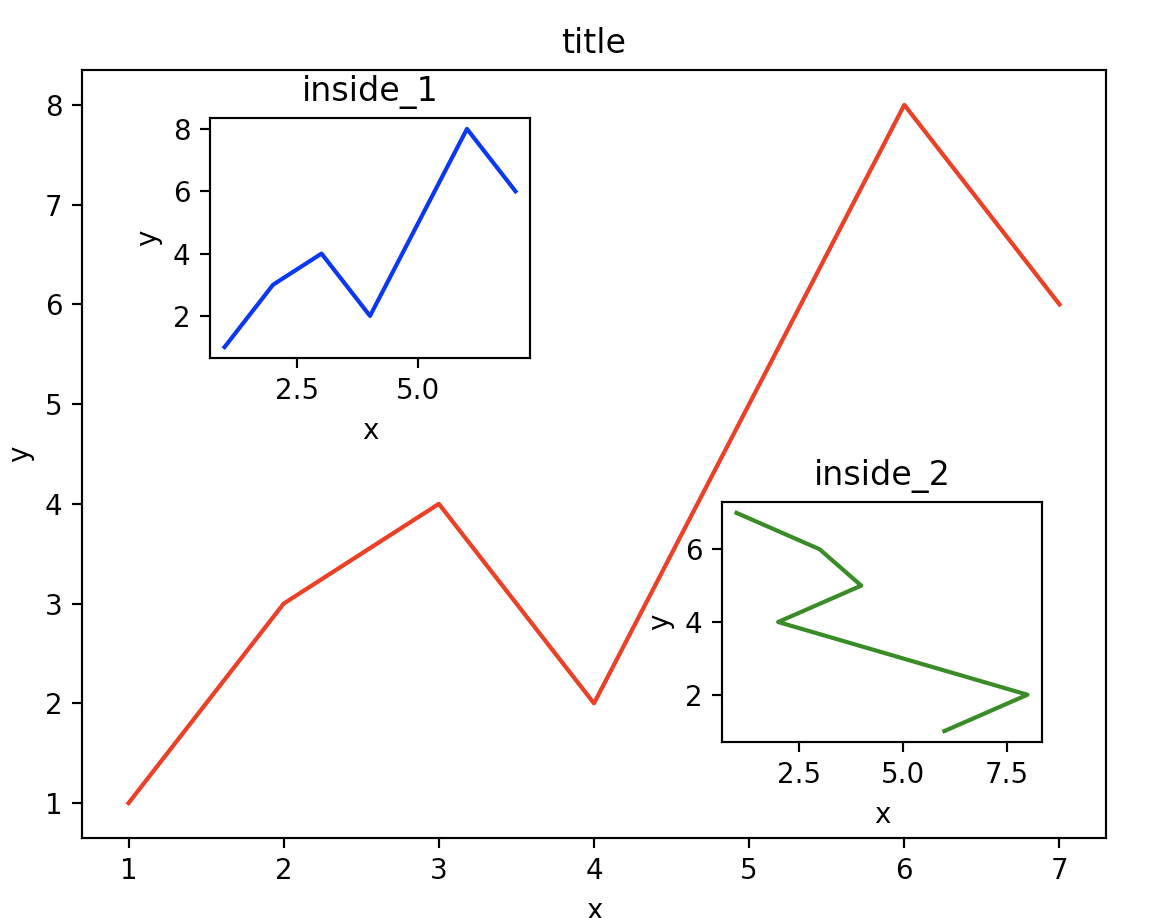
keypoint: 设定各图的坐标占画布的比例
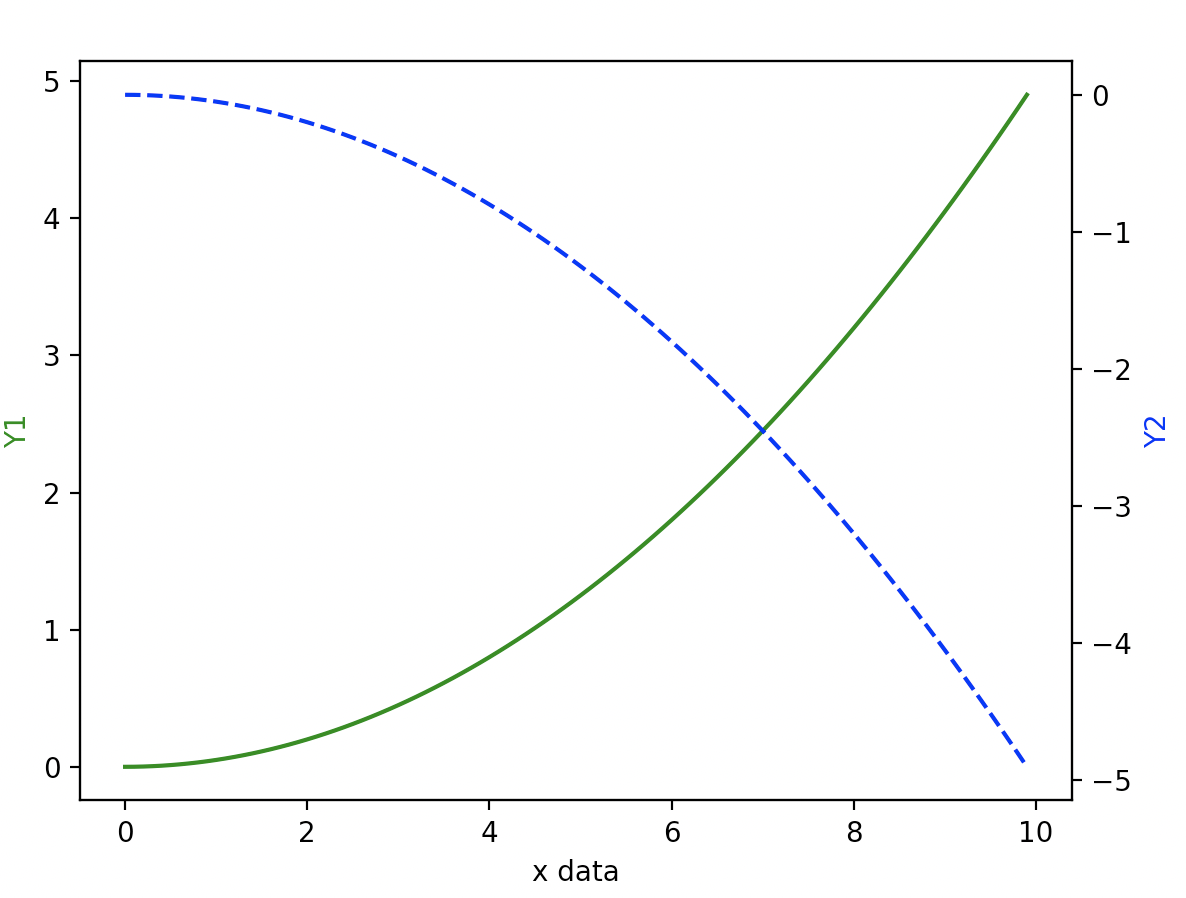
共享x轴
x = np.arange(0,10,0.1)y1 =0.05*x**2y2 = -1*y1fig,ax1 = plt.subplots()ax2 = ax1.twinx() ## 共享x轴,x2 为x1的镜像翻转ax1.plot(x,y1,'g-')ax2.plot(x,y2,'b--')ax1.set_xlabel('x data')ax1.set_ylabel('Y1',color='green')ax2.set_ylabel('Y2',color='blue')plt.show()
动画
import matplotlib.pyplot as pltimport numpy as npfrom matplotlib import animationfig,ax = plt.subplots()x = np.arange(0,2*np.pi,0.01)line,= ax.plot(x, np.sin(x)) ## ,因为plot返回值是一个list,直接调用值也是一个list,,用,破除def animate(i):line.set_ydata(np.sin(x+i/10))return line,def init():line.set_ydata(np.sin(x))return line,ani = animation.FuncAnimation(fig=fig,func=animate,frames=100,init_func=init,interval=20,blit=False)plt.show()
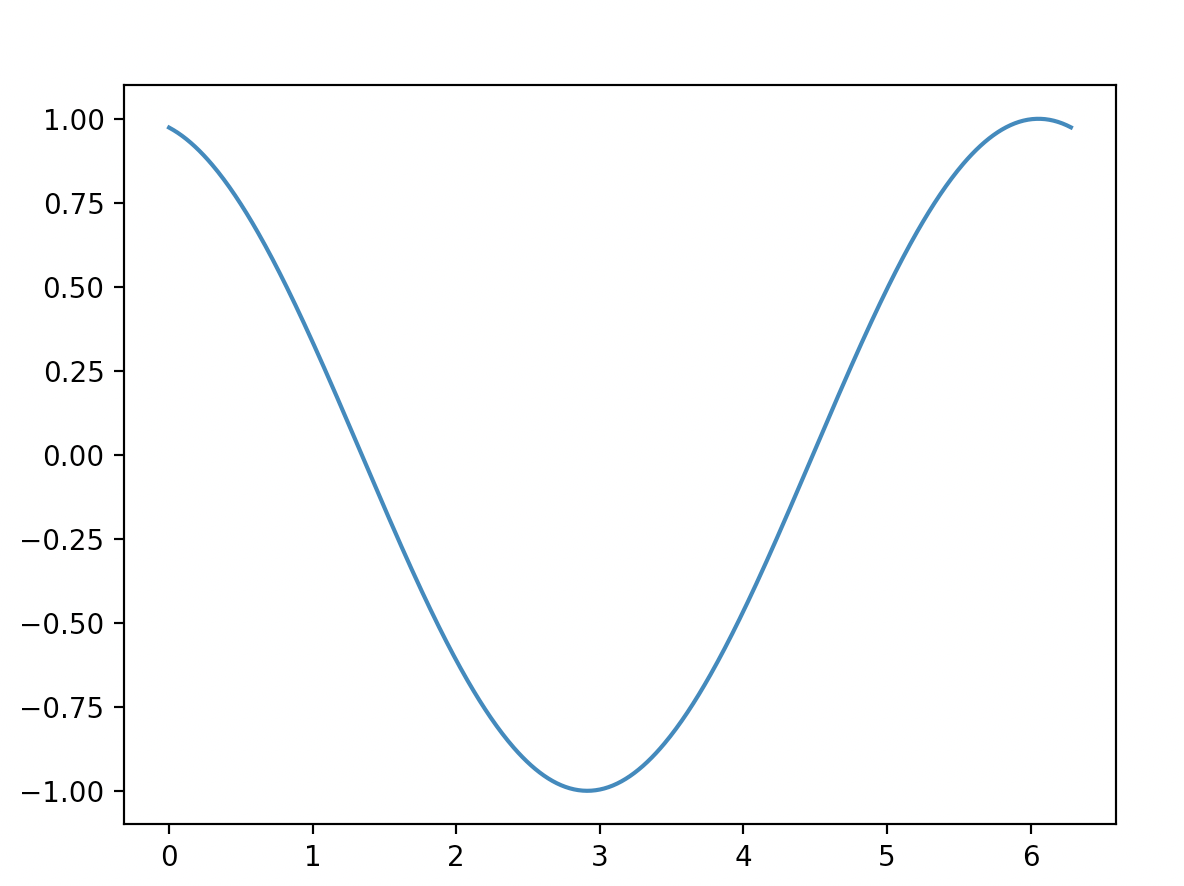
动起来!(截图看不到)
完结,撒花~
参考:https://github.com/MorvanZhou/tutorials/tree/master/matplotlibTUT
https://www.bilibili.com/video/BV1Jx411L7LU?p=19

若有收获,就点个赞吧
0 人点赞
