
- matplotlib
第一个小例子
import matplotlib.pyplot as pltimport numpy as npx = np.linspace(-1,1,50)#y = 2*x +1y = x**2plt.plot(x,y)plt.show()
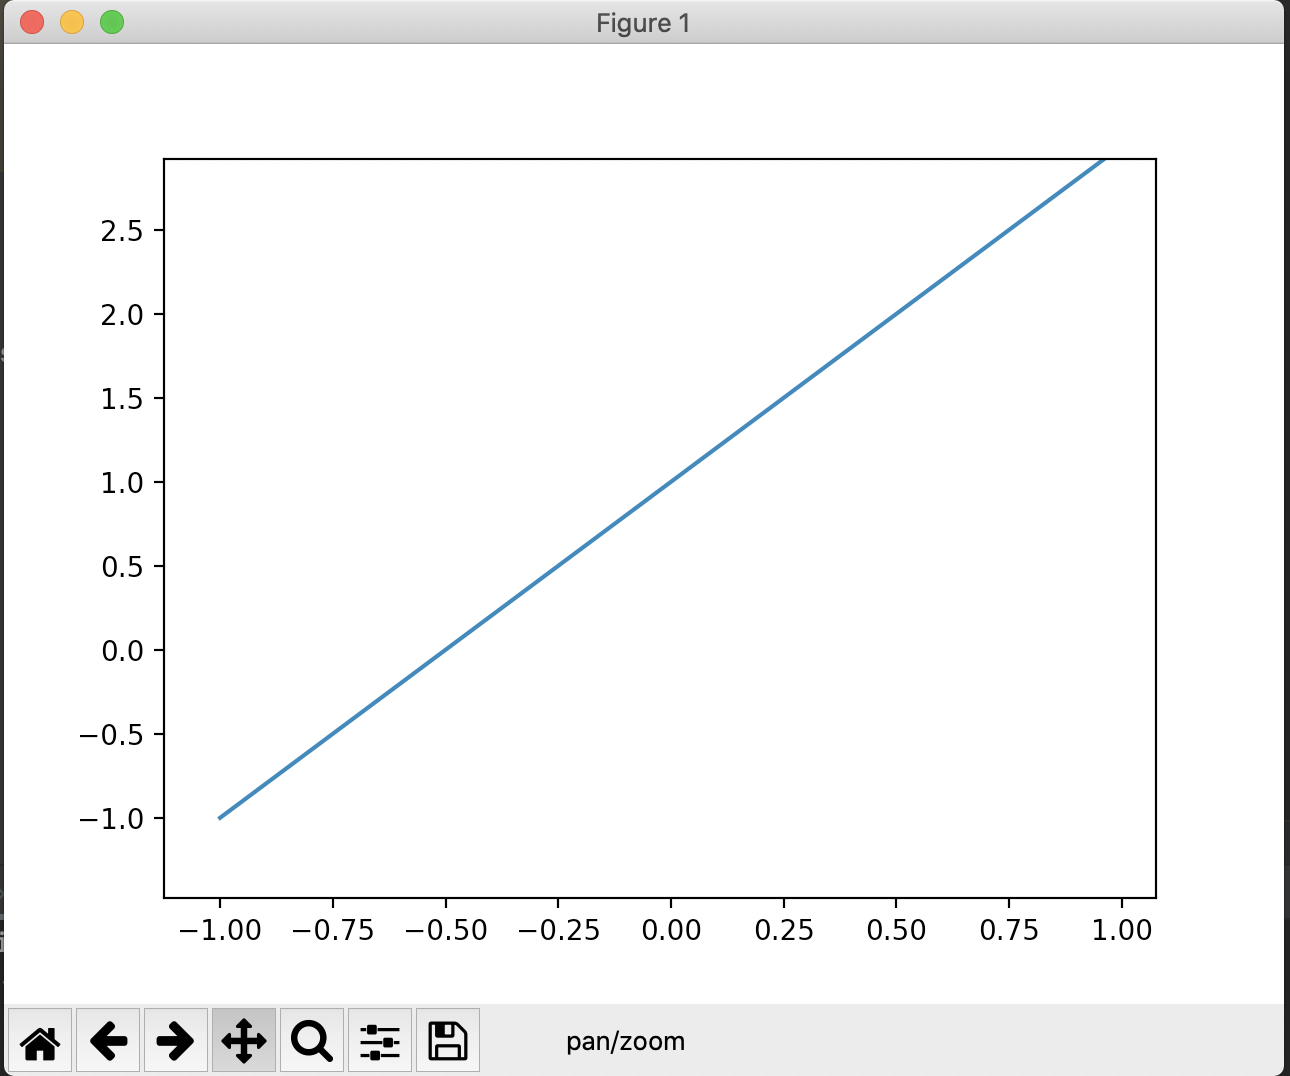
生成的图片地下,有一溜小图标,每个都可以试试
第二个小例子
import matplotlib.pyplot as pltimport numpy as npx = np.linspace(-3,3,50)y1 = 2*x +1y2 = x**2plt.figure() ## 每一张figure的开头plt.plot(x,y1)plt.show()## 先定figure的开头,下面参数都与这张figure相关,直到下一张figureplt.figure(num=3,figsize=(8,5)) ## 可以指定编号,图片大小plt.plot(x,y2) ## 画第一条线plt.plot(x,y1,color='red',linewidth=1.0,linestyle='--')plt.show()
会出两张图片,第二张如下,画两条线,每条线对应一个plt函数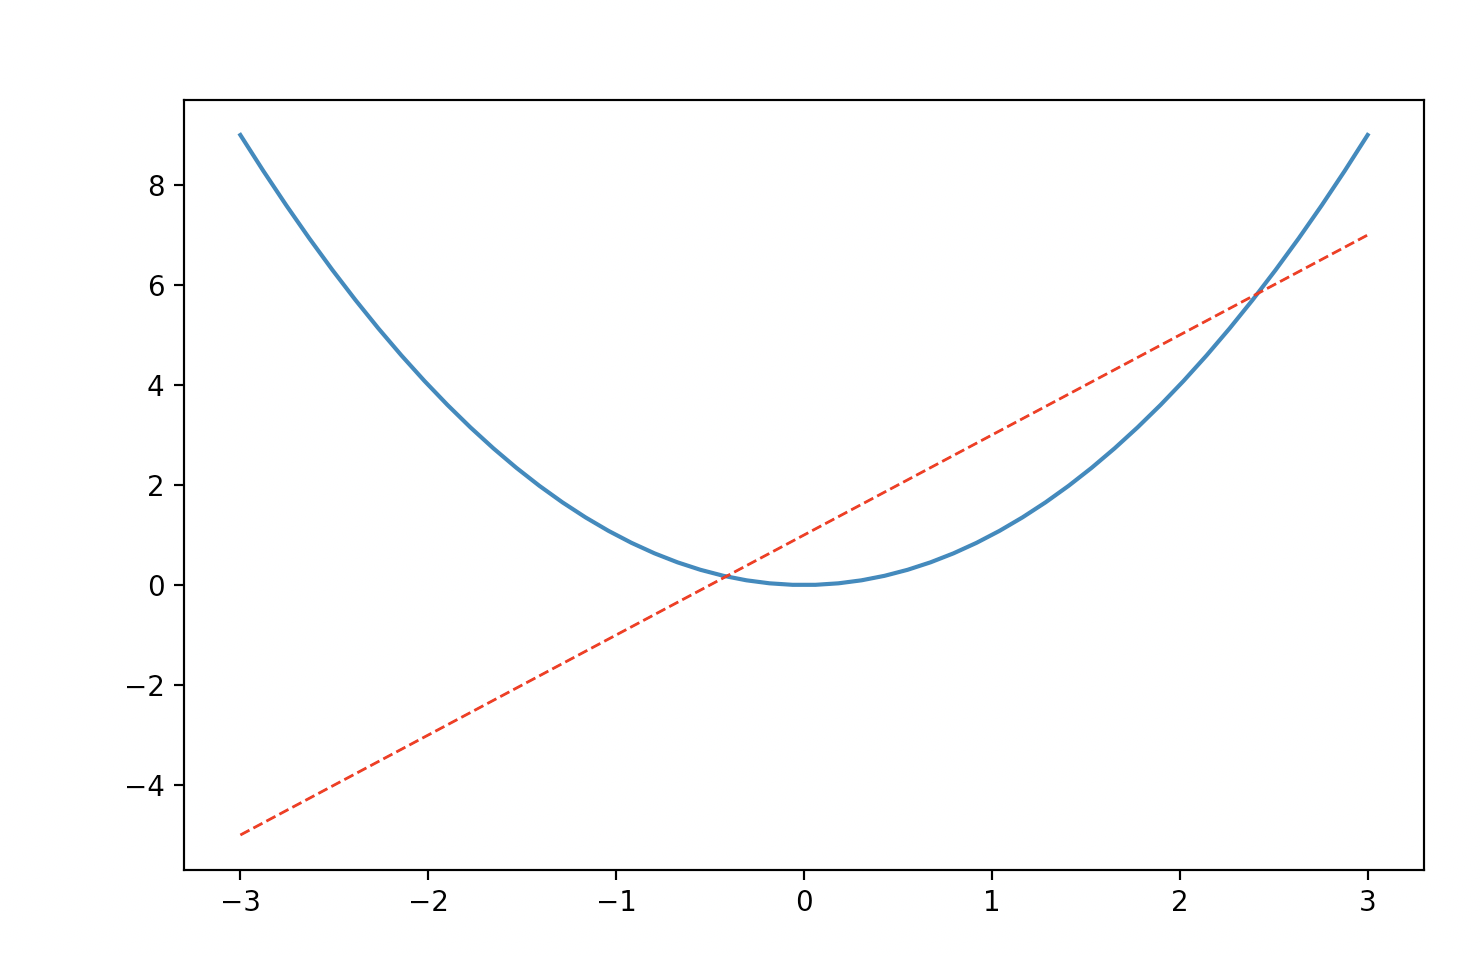
修改坐标标尺、标签、取值范围等
plt.xlim((-1,2)) ## x轴取值范围plt.ylim((-2,3)) ## y轴取值范围plt.xlabel('I am x') ## x轴标签plt.ylabel('I am y') ## y轴标签new_ticks = np.linspace(-1,2,5)plt.xticks(new_ticks) ## x轴刻度plt.yticks([-2,-1,0,1,3],[r'$really\ bad$',r'$bad\ \alpha$',r'$normal$',r'$good$',r'$really\ good$'])## 注:'\'为转译字符,可以转译空格和希腊字母 ,修改字体可以用正则匹配
设置边框,挪动坐标轴
# gca = 'get current axis'ax = plt.gca() ## 拿到的是四个边框ax.spines['right'].set_color('none') ## 上、右边框去掉ax.spines['top'].set_color('none')ax.xaxis.set_ticks_position('bottom') ## 左、下边框设为y、x轴ax.yaxis.set_ticks_position('left')ax.spines['bottom'].set_position(('data',0)) ## 挪动x轴,按照y的值挪动ax.spines['left'].set_position(('data',0)) ## 挪动y轴,按照x的值挪动
图就变成这样啦 (我觉得比R里面的ggplot2好用)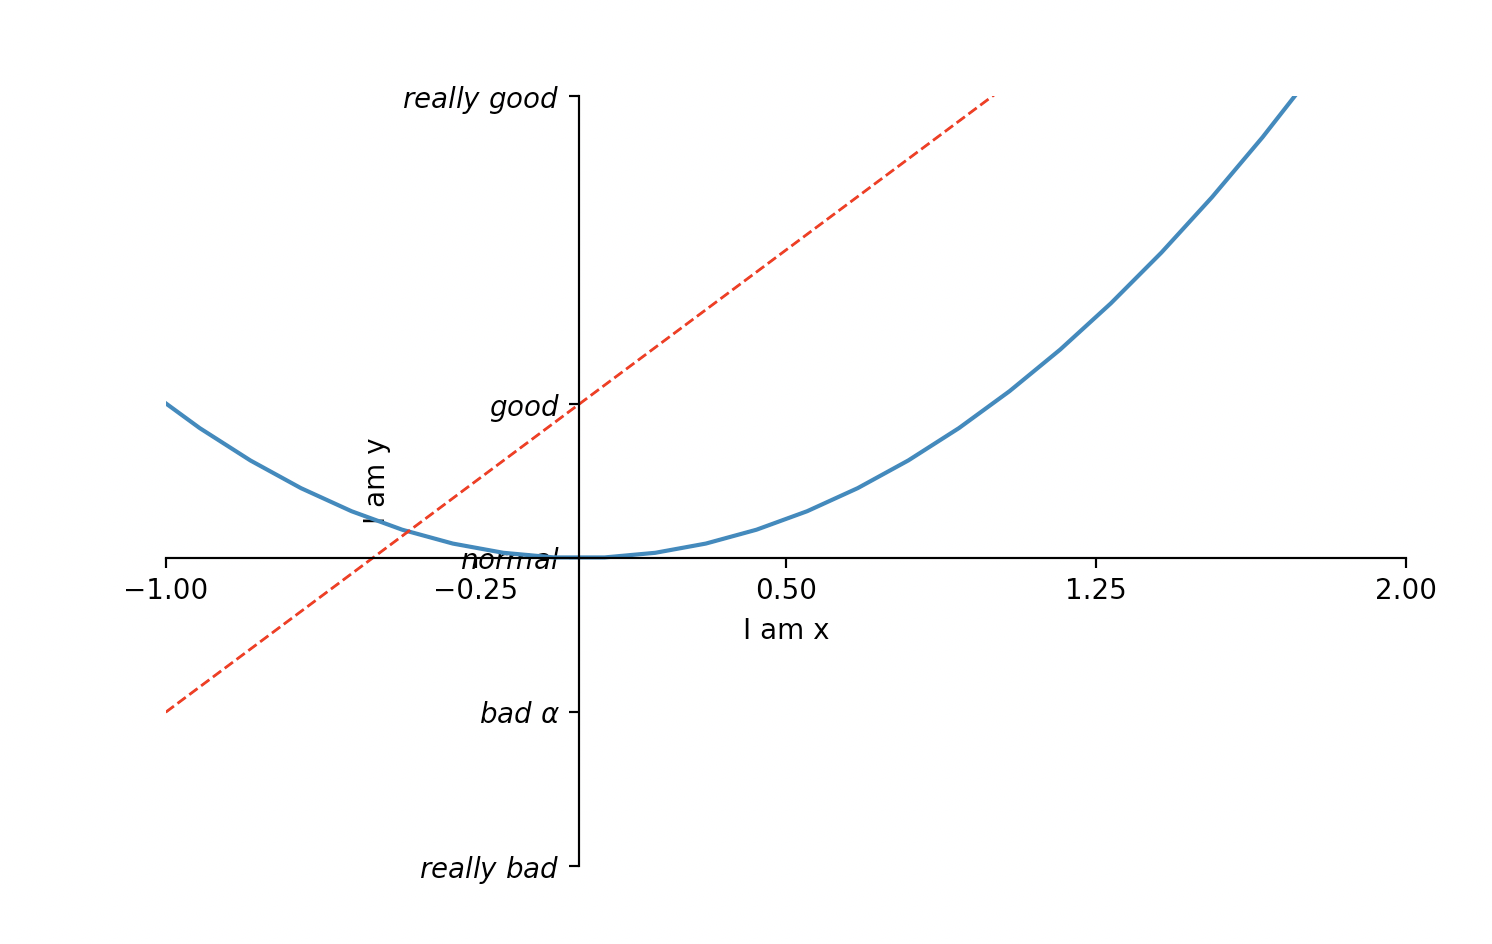
加个图例
l1,=plt.plot(x,y2,label='up') ## 画第一条线l2,=plt.plot(x,y1,color='red',linewidth=1.0,linestyle='--',label='down') ## 要加上逗号,否则报错plt.legend(handles=[l1,l2],labels=["aaa","bbb"],loc='best')## handles 用来放入legent里的线,label分别给他们命名,需要给plt.plot()返回的对象命名# loc=best,自己给图例找地方## 不想麻烦就不用命名,legend用默认值
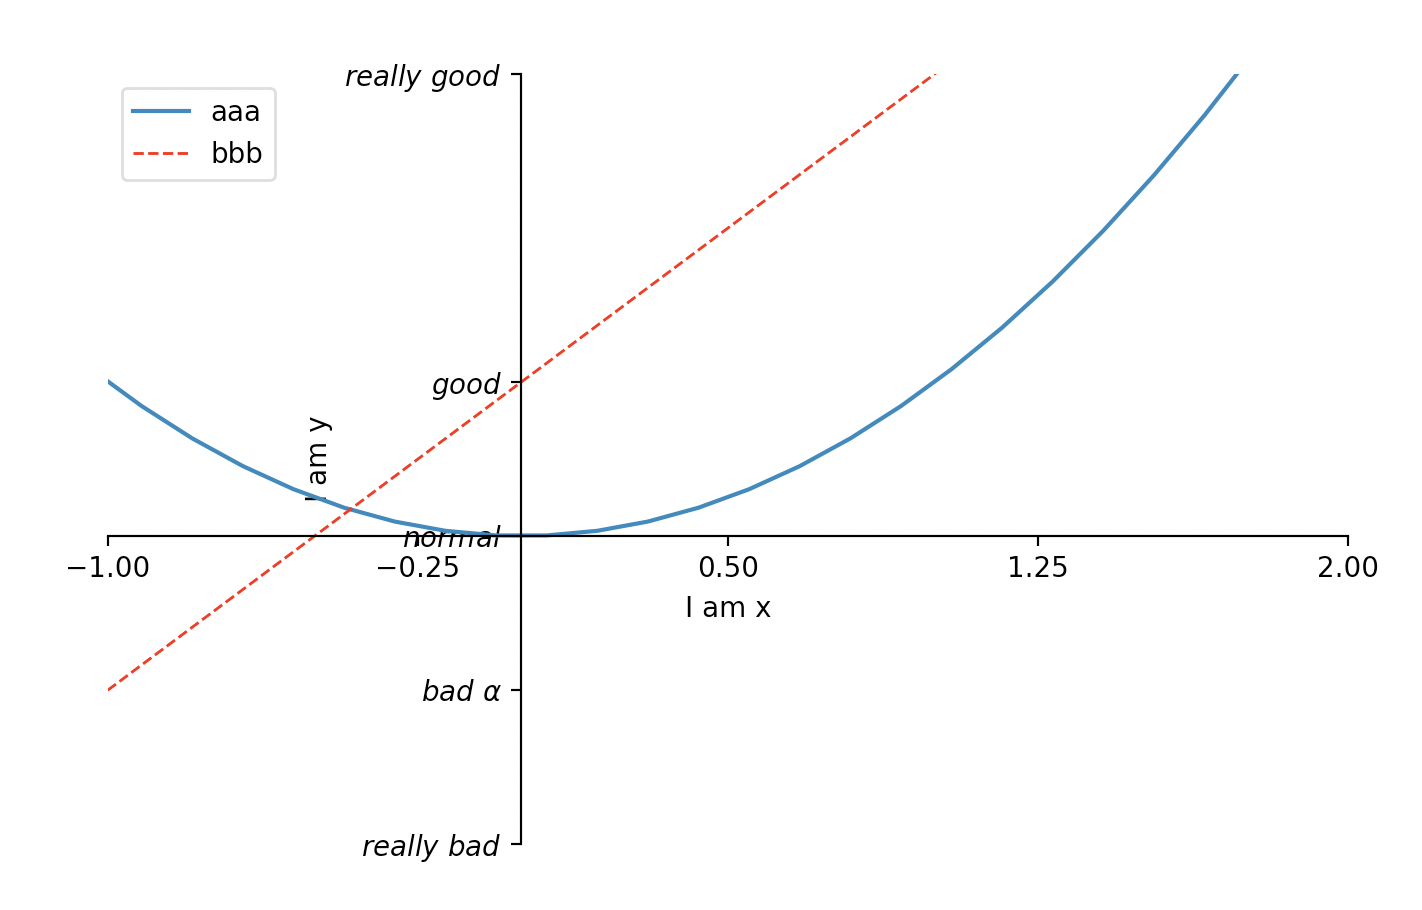
图例自己找了个地方,在左上角呆着了
在图上加个注解
## 设置要标注的点的坐标x0 =1y0 = 2*x0 +1plt.scatter(x0,y0,s=50,color='b')plt.plot([x0,x0],[y0,0],'k--',lw=2.5) ## k-- is simple for dark --,lw for linewidth## 箭头标注点plt.annotate(r'$2x+1=%s$'% y0,xy=(x0,y0),xycoords='data',xytext=(+30,-30), ## xy的位置基于(x0,y0)点分别+30,-30textcoords='offset points',fontsize=16,arrowprops=dict(arrowstyle='->', connectionstyle='arc3,rad=.2')) ## 箭头的形状, 箭头的弧度## 加个文字注释plt.text(-3.7,3,r'$This\ is\ the\ text.\ \mu\ \sigma_i\ \alpha_t$',fontdict={'size':16,'color':'r'})
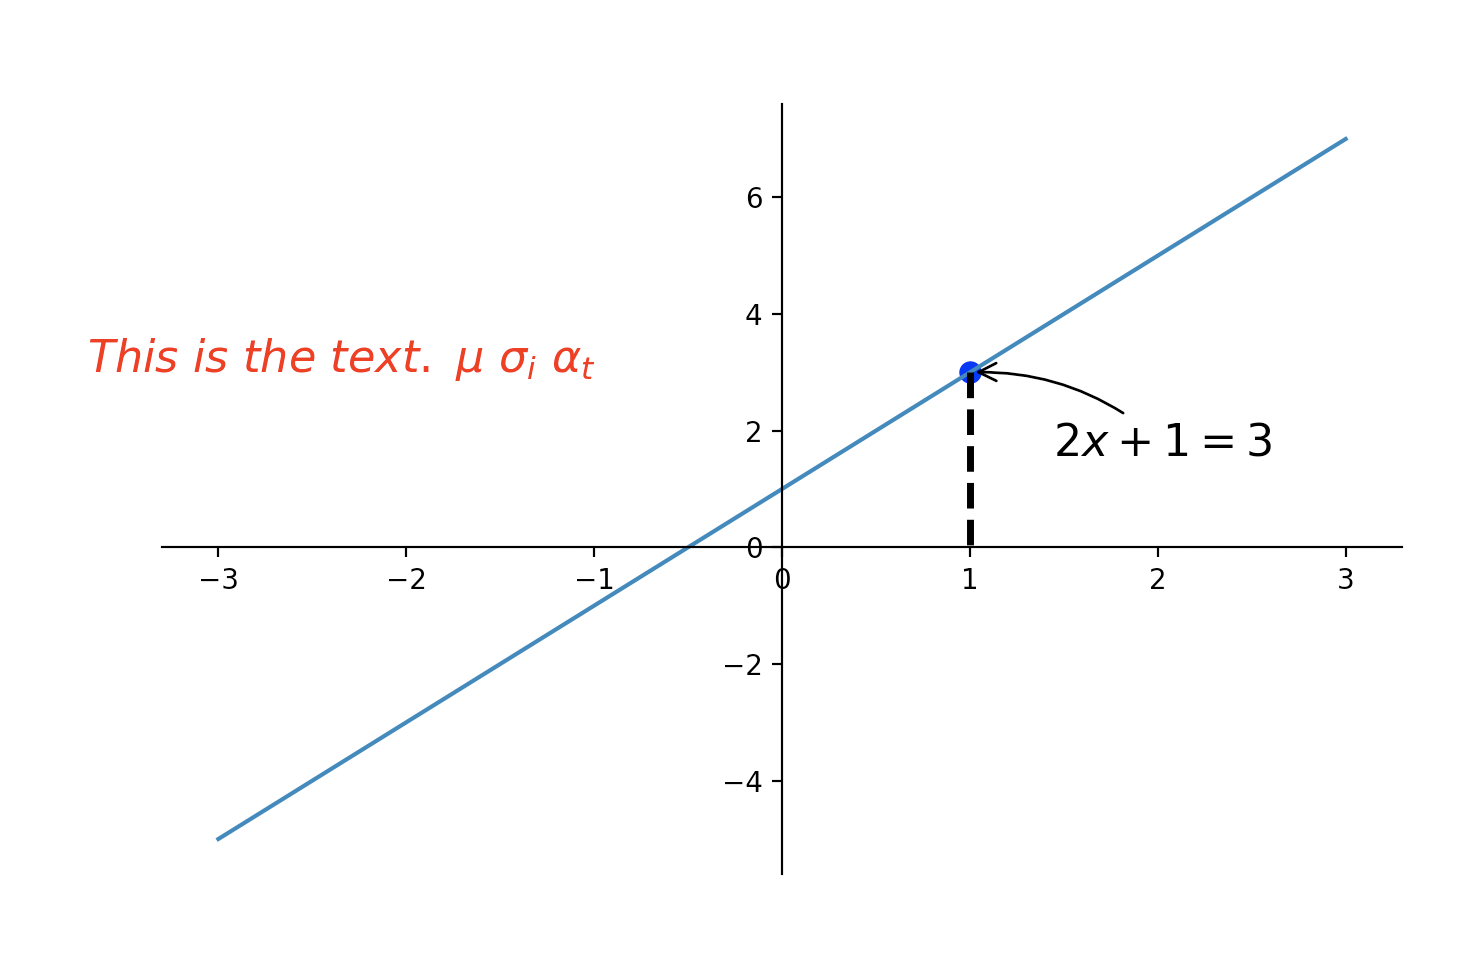
漂亮的注释~~
更多注释相关参数可见:https://blog.csdn.net/leaf_zizi/article/details/82886755
x = np.linspace(-3,3,50)y1 = 2*x +1plt.figure(num=1,figsize=(8,5)) ## 可以指定编号,图片大小plt.plot(x, y1,linewidth=10,zorder=1)# gca = 'get current axis'ax = plt.gca() ## 拿到的是四个边框ax.spines['right'].set_color('none') ## 上、右边框去掉ax.spines['top'].set_color('none')ax.xaxis.set_ticks_position('bottom') ## 左、下边框设为y、x轴ax.yaxis.set_ticks_position('left')ax.spines['bottom'].set_position(('data',0)) ## 挪动x轴,按照y的值挪动ax.spines['left'].set_position(('data',0)) ## 挪动y轴,按照x的值挪动for label in ax.get_xticklabels() + ax.get_yticklabels():label.set_fontsize(12)label.set_bbox(dict(facecolor='white',edgecolor='None',alpha=0.7,zorder=2))plt.show()
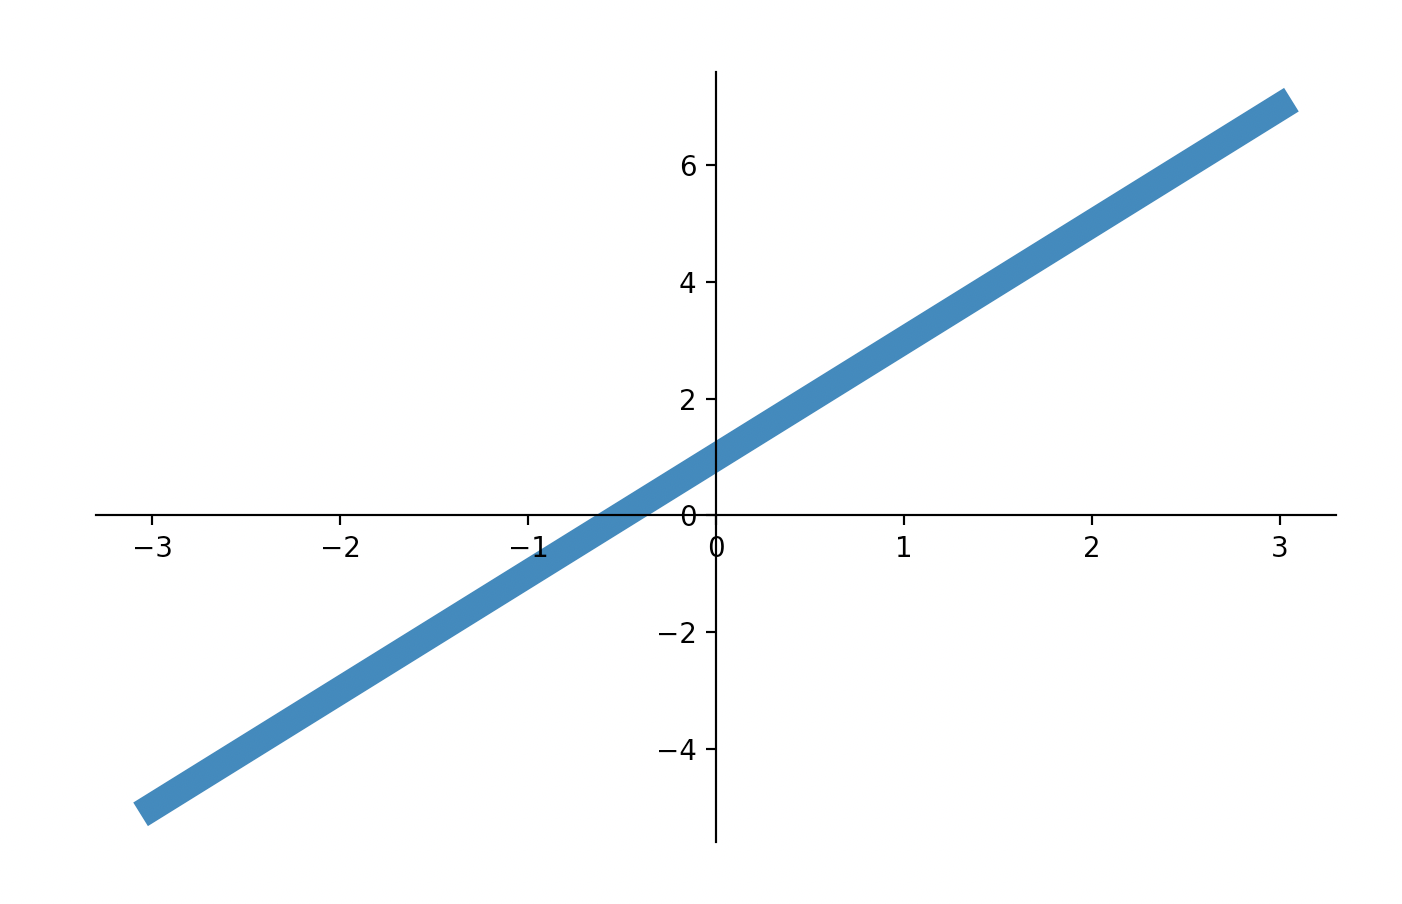
希望线无论多款,刻度都不被遮挡
for label in ax.get_xticklabels() + ax.get_yticklabels():label.set_fontsize(12)label.set_bbox(dict(facecolor='white',edgecolor='None',alpha=0.7,zorder=2))## zorder有点像ps中的涂层,需要为线和矿分别设置zorder,并且order大的才能显示出来
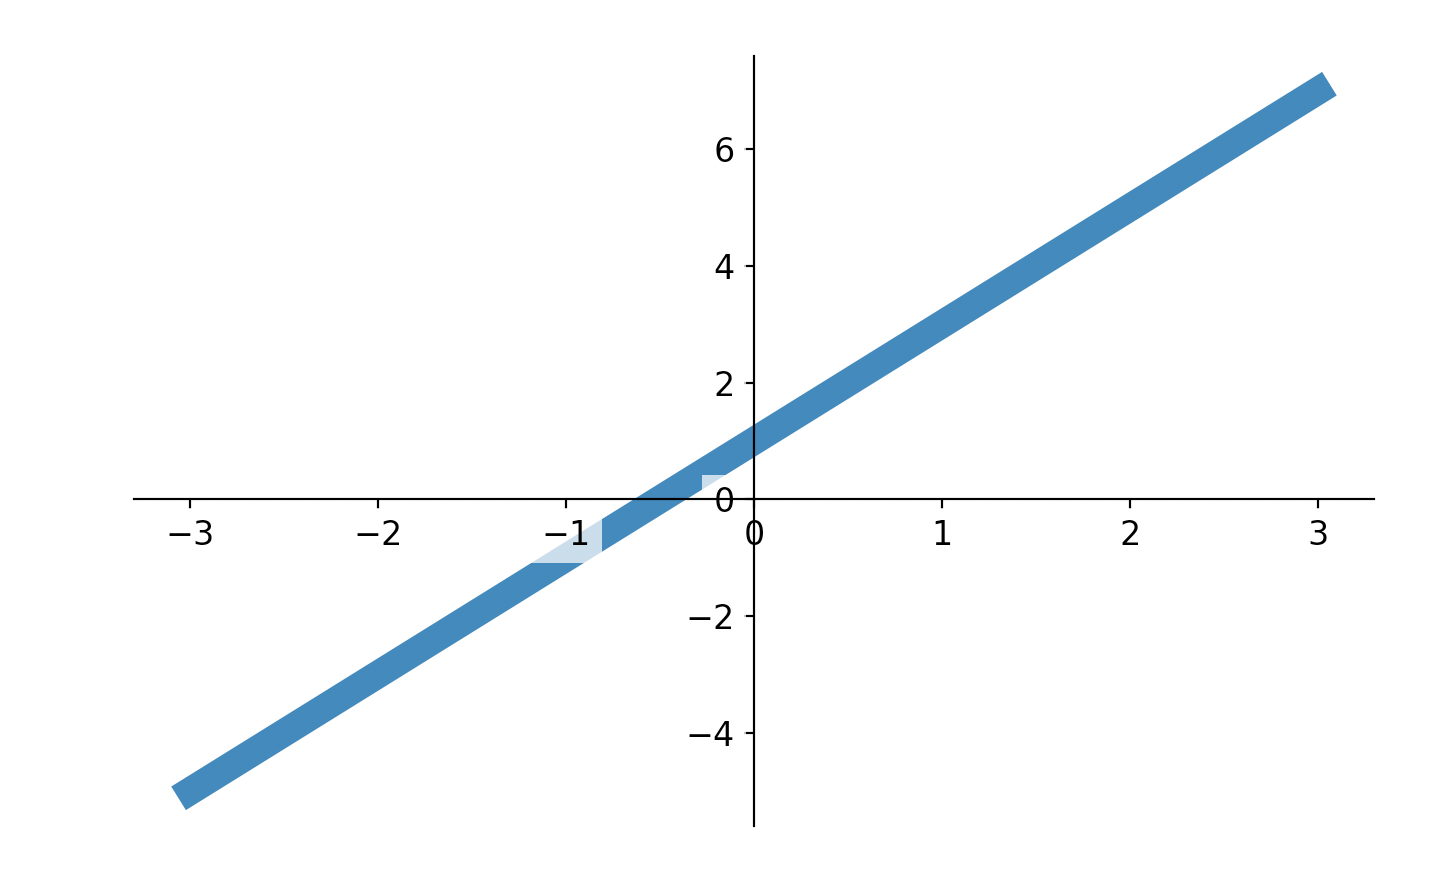
给刻度加一个小白框,颜色和背景色一样
线就先捣鼓到这啦~

