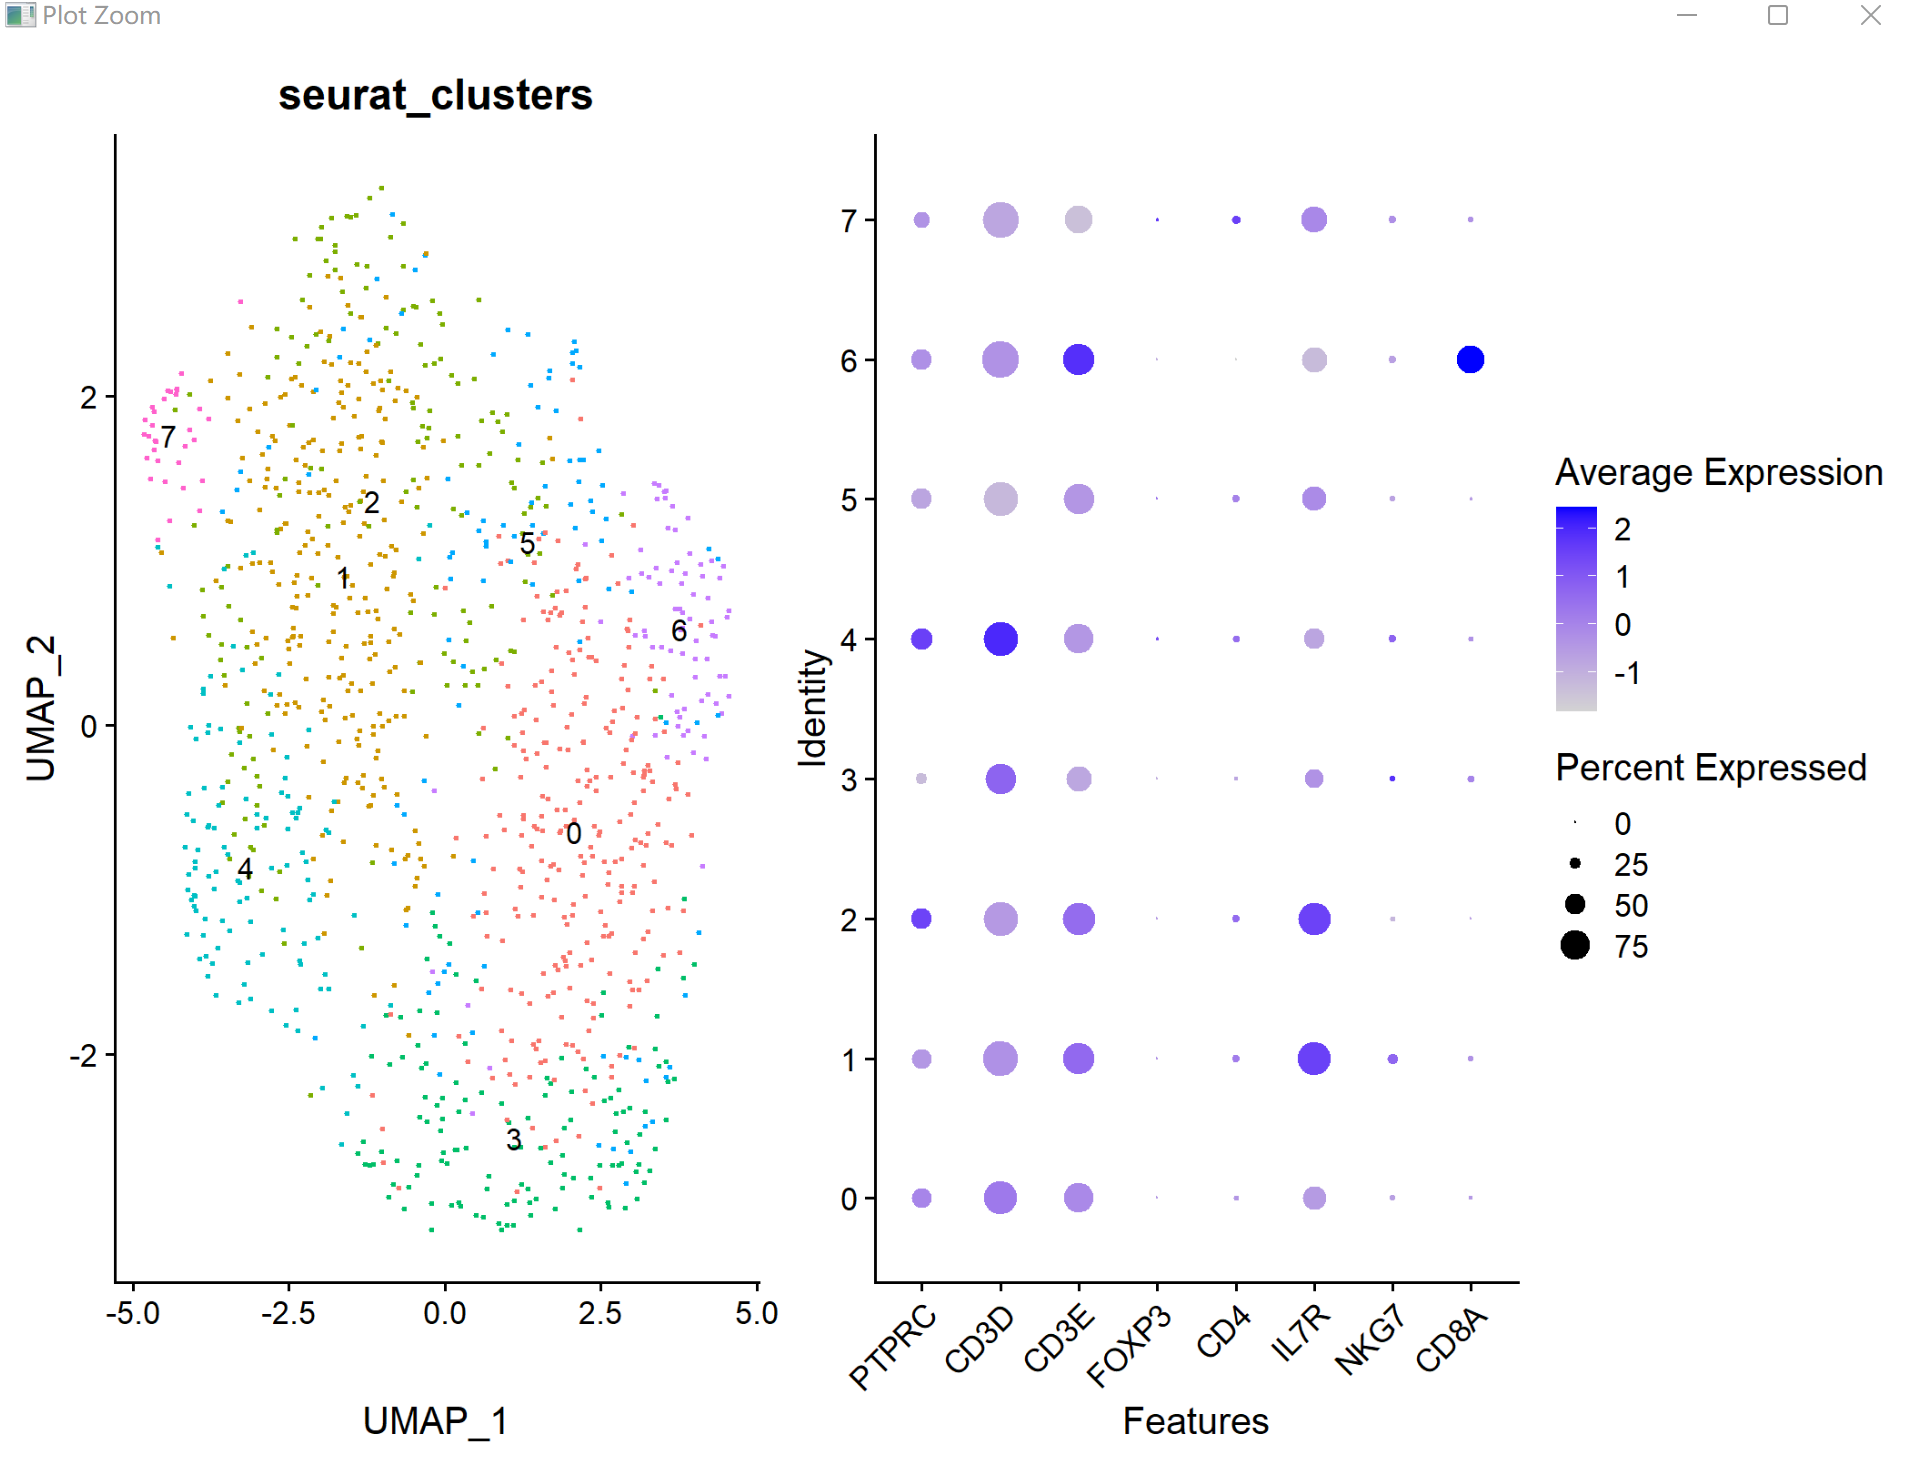
#提取单细胞亚群子集rm(list = ls())library(Seurat)# devtools::install_github('satijalab/seurat-data')library(SeuratData)library(ggplot2)library(patchwork)library(dplyr)load(file = 'basic.sce.pbmc.Rdata')DimPlot(pbmc,reduction = 'umap',label = TRUE, pt.size = 0.5) + NoLegend()FeaturePlot(pbmc,features = c("CD4"))sce=pbmcIdents(sce)levels(sce)head(sce@meta.data)genes_to_check = c('PTPRC', 'CD3D', 'CD3E','CD4','IL7R','NKG7','CD8A')DotPlot(sce,group.by = 'seurat_clusters',features = unique(genes_to_check)) + RotatedAxis()DotPlot(sce, # group.by = 'seurat_clusters',features = unique(genes_to_check)) + RotatedAxis()p1=DimPlot(sce,reduction = 'umap',group.by = 'seurat_clusters',label = TRUE, pt.size = 0.5) + NoLegend()p2=DotPlot(sce,group.by = 'seurat_clusters',features = unique(genes_to_check)) + RotatedAxis()p1+p2#在R里面取子集方法:逻辑值,坐标,名字#取子集方法1:cd4_sce1 = sce[,sce@meta.data$seurat_clusters %in% c(0,2)]#取子集方法2:cd4_sce2 = sce[, Idents(sce) %in% c("Naive CD4 T","Memory CD4 T")]#subset 函数也可以,手写函数也行cd4_sce1cd4_sce2#代码不要变动sce=cd4_sce1sce <- NormalizeData(sce,normalization.method = "LogNormalize",scale.factor = 1e4)sce <- FindVariableFeatures(sce,selection.method = 'vst',nfeatures = 2000)sce <- ScaleData(sce,vars.to.regress = "percent.mt")sce <- RunPCA(sce,features = VariableFeatures(object = sce))sce <- FindNeighbors(sce,dims = 1:10)sce <- FindClusters(sce,resolution = 1 )# Look at cluster IDs of the first 5 cellshead(Idents(sce), 5)table(sce$seurat_clusters)sce <- RunUMAP(sce,dims = 1:10)DimPlot(sce,reduction = 'umap')genes_to_check = c('PTPRC', 'CD3D', 'CD3E', 'FOXP3','CD4','IL7R','NKG7','CD8A')DotPlot(sce,group.by = 'seurat_clusters',features = unique(genes_to_check)) + RotatedAxis()# 亚群水平p1=DimPlot(sce,reduction = 'umap',group.by = 'seurat_clusters',label = TRUE, pt.size = 0.5) + NoLegend()p2=DotPlot(sce,group.by = 'seurat_clusters',features = unique(genes_to_check)) + RotatedAxis()p1+p2save(sce,file = 'sce.cd4.subset.Rdata')load(file = 'sce.cd4.subset.Rdata')#先执行不同resolution 下的分群library(Seurat)library(clustree)sce <- FindClusters(object = sce,resolution = c(seq(.1,1.6,.2)))clustree(sce@meta.data, prefix = "RNA_snn_res.")


若有收获,就点个赞吧
0 人点赞
