说明
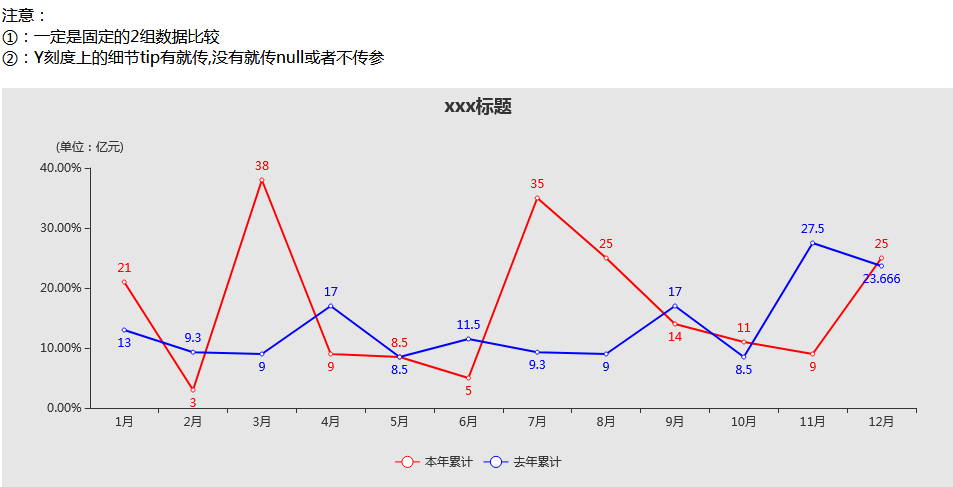
有时候项目组要求做的一些折线图比较奇葩一点,比如本年每个月的数据和去年的数据进行比较,而且标注的文字要根据数据的大小变化,大的值标注的文字在上面,小的值标注的文字要在下面,这个案例在官方或者论坛上都没有案例,后面经过自己的一些想法和研究,搞了一个案例出来了。
废话不多说,直接上干货。
示例图
HTML代码
<div id="main" style="width: 50%;height:400px;margin: 0 auto;"></div>
JS代码
<script src="js/jquery-1.6.2.min.js"></script><script src="js/echarts.min.js"></script><script>$(function () {var data={title:"xxx标题",color:["red","blue"],x:['1月','2月','3月','4月','5月','6月','7月','8月','9月','10月','11月','12月'],y:[{min:null,max:null,name:"(单位:亿元)"}],data:[{name:"本年累计",data:["21","3","38","9","8.5","5","35","25","14","11","9","25"]},{name:"去年累计",data:["13","9.3","9","17","8.5","11.5","9.3","9","17","8.5","27.5","23.666"]}]};//前端细节区分var tip={tofiexd:2,//y轴刻度保留2位数小数unit:"%",//y轴刻度单位}drawLine("main","line_auto_up_down",data,tip);});/*** @func* @desc 折线函数* @param {string} id - string |目标id* @param {string} type - string | line_auto_up_down(双折线,并且排列标记字的位置* @param {object} data - 后端数据 @returns {...}* @param {object} tip - 前端重定义echar画图细节和区别 @returns {...}**/function drawLine(id,type,data,tip){var myChart = echarts.init(document.getElementById(id));var option = {backgroundColor:"rgba(10,10,10,0.1)",title: {text: "默认标题",x: 'center',top: '5'},tooltip: {trigger:'axis',confine: true,axisPointer:{type:"line"}},legend:{show:true,bottom: 15,},xAxis: {type: 'category',data: ['周一','周二','周三','周四','周五','周六','周日']},yAxis: [{type: 'value',show: true,min: null,max: null,name:"(单位:xx)",splitLine:{show:false}},{type: 'value',show: false,min: null,max: null,name:"(单位:xx)",splitLine:{show:false}},],grid: {left: '4%',right: '4%',bottom: '15%',top:"20%",containLabel: true},series: []}//后端传数据源进行处理if(data.title){option.title.text = data.title;}if(data.color){var arrColor = data.color;option.color = arrColor;}if(data.x){option.xAxis.data = data.x;}//全局处理设置Y轴刻度单位(默认无单位),显示多少位小数(默认0位)var sunit = "",stofixed = 0;//前端控制设置if(tip){if(tip.tofiexd){stofixed = tip.tofiexd}if(tip.unit){sunit = tip.unit}}for(var mm=0;mm<data.y.length;mm++){if( data.y[mm].name){option.yAxis[mm].name = data.y[mm].name;}if( data.y[mm].min){option.yAxis[mm].min = data.y[mm].min;}if( data.y[mm].max){option.yAxis[mm].max = data.y[mm].max;}option.yAxis[mm].axisLabel={formatter: function(val){if(stofixed == 0){return val + sunit;}else{return val.toFixed(stofixed) + sunit;}}}}if(data.y.length > 1){//双Y轴处理option.yAxis[1].show = true;}//line_auto_up_down标注文字上下自动排序显示类型处理if(type=="line_auto_up_down"){var arrVal1=[],arrVal2=[];for(var i=0;i<data.data.length;i++){var val=data.data[i];var tmp={name:val.name,yAxisIndex:0,type:"line",data:[]}for(var j=0;j<val.data.length;j++){var vval={value:val.data[j],label:{show:true},};tmp.data.push(vval)}option.series.push(tmp)}for(var j=0;j<data.data[0].data.length;j++){arrVal1.push(data.data[0].data[j])arrVal2.push(data.data[1].data[j])}//判断数组大小并进行上下自动显示if(arrVal1.length == arrVal2.length){for(var j=0;j<arrVal1.length;j++){var val0 = option.series[0].data[j].value;var val1 = option.series[1].data[j].value;if(Number(val0)>Number(val1) || Number(val0)==Number(val1)){option.series[0].data[j].label.position="top";option.series[1].data[j].label.position="bottom";}else{option.series[0].data[j].label.position="bottom";option.series[1].data[j].label.position="top";}}}}// 画图myChart.setOption(option,true);myChart.resize();}</script>
本文为原创文章,转载请附上原文链接!

若有收获,就点个赞吧
0 人点赞
