说明
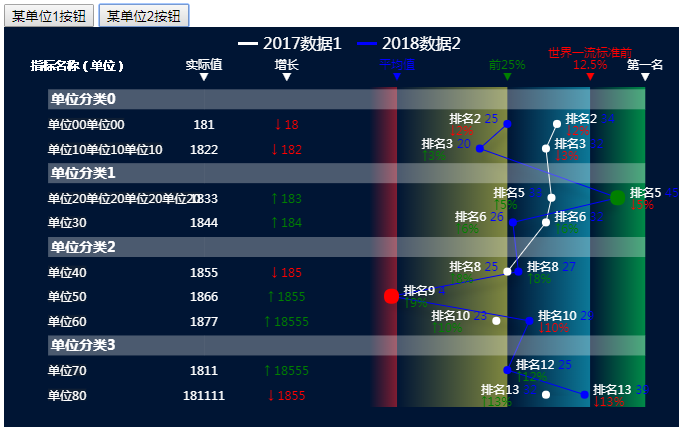
要求做表格类型竖着折线图
示例图
HTML代码
<button id="btn1">某单位1按钮</button><button id="btn2">某单位2按钮</button><div id="main" style="width: 50%;height:400px;"></div>
JS代码
<script src="js/jquery-1.6.2.min.js"></script><script src="js/echarts.min.js"></script><script>$(function () {var jsonData={backgroundColor: '#001534',topData:{planTitle:"计划值1",planLineOne:"2017数据1",planLineTwo:"2018数据2",topPlanTipIsTrue:true},topColor:["rgba(0,255,91,0.5)","rgba(0,255,91,1)","#18daff","#fffa4a"],yAxisText1:[{value :-15,text:""},{value :-15,text:"↓ 18",upIsTrue:false},{value :-15,text:"↑ 4664",upIsTrue:true},{value :-15,text:""},{value :-15,text:"↓ 183",upIsTrue:false},{value :-15,text:"↓ 184",upIsTrue:false},{value :-15,text:""},{value :-15,text:"↓ 185",upIsTrue:false},{value :-15,text:"↑ 1855",upIsTrue:true},{value :-15,text:"↑ 18555",upIsTrue:true},{value :-15,text:""},{value :-15,text:"↑ 18555",upIsTrue:true},{value :-15,text:"↑ 1855",upIsTrue:true}],yAxisText2:[{value :-30,text:""},{value :-30,text:"181"},{value :-30,text:"1822"},{value :-30,text:""},{value :-30,text:"1833"},{value :-30,text:"1844"},{value :-30,text:""},{value :-30,text:"1855"},{value :-30,text:"1866"},{value :-30,text:"1877"},{value :-30,text:""},{value :-30,text:"1811"},{value :-30,text:"181111"}],yAxis:{name:"指标名称(单位)",data:[{value:'单位分类0',textStyle:{width:150,align:"left",rich:{},color:"#fff",fontWeight:"bold",fontSize:14,backgroundColor:"rgba(190,290,290,0.3)",padding:3}},{value:'单位00单位00',textStyle:{align:"left"}},{value:'单位10单位10单位10',textStyle:{align:"left"}},{value:'单位分类1',textStyle:{width:150,align:"left",rich:{},color:"#fff",fontWeight:"bold",fontSize:14,backgroundColor:"rgba(250,250,250,0.3)",padding:3}},{value:'单位20',textStyle:{align:"left"}},{value:'单位30',textStyle:{align:"left"}},{value:'单位分类2',textStyle:{width:150,align:"left",rich:{},color:"#fff",fontWeight:"bold",fontSize:14,backgroundColor:"rgba(250,250,250,0.3)",padding:3}},{value:'单位40',textStyle:{align:"left"}},{value:'单位50',textStyle:{align:"left"}},{value:'单位60',textStyle:{align:"left"}},{value:'单位分类3',textStyle:{width:150,align:"left",rich:{},color:"#fff",fontWeight:"bold",fontSize:14,backgroundColor:"rgba(250,250,250,0.3)",padding:3}},{value:'单位70',textStyle:{align:"left"}},{value:'单位80',textStyle:{align:"left"}},],yAxisUnit:[{yAxis: "单位分类0"},{yAxis: "单位分类1"},{yAxis: "单位分类2"},{yAxis: "单位分类3"}]},xAxis:{min:-30,max:50,markArea:{nwIsTrue:true,borderColor:"rgba(0,255,91,1)",data: [{startNum:"-15",endNum:"-30",startColor:"rgba(0,0,0,0.0)",endColor:"rgba(0,0,0,0.0)",text:"实际值\n▼"},{startNum:"0",endNum:"-15",startColor:"rgba(0,0,0,0.0)",endColor:"rgba(0,0,0,0.0)",text:"增长\n▼"},{startNum:"0",endNum:"5",startColor:"rgba(255,36,47,0.0)",endColor:"rgba(255,36,47,0.5)",text:"平均值\n▼"},{startNum:"5",endNum:"25",startColor:"rgba(255,250,74,0.0)",endColor:"rgba(255,250,74,0.5)",text:"前25%\n▼"},{startNum:"25",endNum:"40",startColor:"rgba(24,218,250,0.0)",endColor:"rgba(24,218,250,0.5)",text:"世界一流标准前\n12.5%\n▼"},{startNum:"40",endNum:"50",startColor:"rgba(0,255,91,0.0)",endColor:"rgba(0,255,91,0.5)",text:"第一名\n▼"},]},markAreaData:[{xAxis:-30},{xAxis:-15},{xAxis:5},{xAxis:25},{xAxis:40},{xAxis:50}// {xAxis:50,label: {borderColor: 'rgba(0,255,91,1)',borderWidth: 3}}]},seriesData:[{data:[{value :null,ranking:"排名1",Percentage:"1%",Static:"0",symbolSize:0,label: {normal:{}},itemStyle:{}},{value :14,ranking:"排名2",Percentage:"2%",Static:"0",symbolSize:8,label: {normal:{}},itemStyle:{}},{value :12,ranking:"排名3",Percentage:"3%",Static:"0",symbolSize:8,label: {normal:{}},itemStyle:{}},{value :8.25,ranking:"排名4",Percentage:"4%",Static:"0",symbolSize:0,label: {normal:{}},itemStyle:{}},{value :4.5,ranking:"排名5",Percentage:"5%",Static:"1",symbolSize:8,label: {normal:{}},itemStyle:{}},{value :12,ranking:"排名6",Percentage:"6%",Static:"1",symbolSize:8,label: {normal:{}},itemStyle:{}},{value :13.5,ranking:"排名7",Percentage:"7%",Static:"1",symbolSize:0,label: {normal:{}},itemStyle:{}},{value :15,ranking:"排名8",Percentage:"8%",Static:"0",symbolSize:8,label: {normal:{}},itemStyle:{}},{value :null,ranking:"排名9",Percentage:"9%",Static:"1",symbolSize:8,label: {normal:{}},itemStyle:{}},{value :13,ranking:"排名10",Percentage:"10%",Static:"1",symbolSize:8,label: {normal:{}},itemStyle:{}},{value :14,ranking:"排名11",Percentage:"11%",Static:"1",symbolSize:0,label: {normal:{}},itemStyle:{}},{value :15,ranking:"排名12",Percentage:"12%",Static:"1",symbolSize:8,label: {normal:{}},itemStyle:{}},{value :19,ranking:"排名13",Percentage:"13%",Static:"0",symbolSize:8,label: {normal:{}},itemStyle:{}}],lineColor:"#18daff"},{data:[{value :null,ranking:"排名1",Percentage:"1%",Static:"0",symbolSize:0,label: {normal:{}},itemStyle:{}},{value :24,ranking:"排名2",Percentage:"2%",Static:"0",symbolSize:8,label: {normal:{}},itemStyle:{}},{value :22,ranking:"排名3",Percentage:"3%",Static:"0",symbolSize:8,label: {normal:{}},itemStyle:{}},{value :31.5,ranking:"排名4",Percentage:"4%",Static:"0",symbolSize:0,label: {normal:{}},itemStyle:{}},{value :4.1,ranking:"排名5",Percentage:"5%",Static:"1",symbolSize:8,label: {normal:{}},itemStyle:{}},{value :22,ranking:"排名6",Percentage:"6%",Static:"1",symbolSize:8,label: {normal:{}},itemStyle:{}},{value :23.5,ranking:"排名7",Percentage:"7%",Static:"1",symbolSize:0,label: {normal:{}},itemStyle:{}},{value :25,ranking:"排名8",Percentage:"8%",Static:"0",symbolSize:8,label: {normal:{}},itemStyle:{}},{value :28,ranking:"排名9",Percentage:"9%",Static:"1",symbolSize:8,label: {normal:{}},itemStyle:{}},{value :23,ranking:"排名10",Percentage:"10%",Static:"1",symbolSize:8,label: {normal:{}},itemStyle:{}},{value :24,ranking:"排名11",Percentage:"11%",Static:"1",symbolSize:0,label: {normal:{}},itemStyle:{}},{value :25,ranking:"排名12",Percentage:"12%",Static:"1",symbolSize:8,label: {normal:{}},itemStyle:{}},{value :29,ranking:"排名13",Percentage:"13%",Static:"0",symbolSize:8,label: {normal:{}},itemStyle:{}}],lineColor:"#fffa4a"},]}var jsonOtherData={backgroundColor: '#001534',topData:{planTitle:"计划值1",planLineOne:"2017数据1",planLineTwo:"2018数据2",topPlanTipIsTrue:false},topColor:["rgba(0,255,91,0.5)","rgba(0,255,91,1)","#fff","blue"],yAxisText1:[{value :-15,text:""},{value :-15,text:"↓ 18",upIsTrue:false},{value :-15,text:"↓ 182",upIsTrue:false},{value :-15,text:""},{value :-15,text:"↑ 183",upIsTrue:true},{value :-15,text:"↑ 184",upIsTrue:true},{value :-15,text:""},{value :-15,text:"↓ 185",upIsTrue:false},{value :-15,text:"↑ 1855",upIsTrue:true},{value :-15,text:"↑ 18555",upIsTrue:true},{value :-15,text:""},{value :-15,text:"↑ 18555",upIsTrue:true},{value :-15,text:"↓ 1855",upIsTrue:false}],yAxisText2:[{value :-30,text:""},{value :-30,text:"181"},{value :-30,text:"1822"},{value :-30,text:""},{value :-30,text:"1833"},{value :-30,text:"1844"},{value :-30,text:""},{value :-30,text:"1855"},{value :-30,text:"1866"},{value :-30,text:"1877"},{value :-30,text:""},{value :-30,text:"1811"},{value :-30,text:"181111"}],yAxis:{name:"指标名称(单位)",data:[{value:'单位分类0',textStyle:{width:150,align:"left",rich:{},color:"#fff",fontWeight:"bold",fontSize:14,backgroundColor:"rgba(250,250,250,0.3)",padding:3}},{value:'单位00单位00',textStyle:{align:"left"}},{value:'单位10单位10单位10',textStyle:{align:"left"}},{value:'单位分类1',textStyle:{width:150,align:"left",rich:{},color:"#fff",fontWeight:"bold",fontSize:14,backgroundColor:"rgba(250,250,250,0.3)",padding:3}},{value:'单位20单位20单位20单位20',textStyle:{align:"left"}},{value:'单位30',textStyle:{align:"left"}},{value:'单位分类2',textStyle:{width:150,align:"left",rich:{},color:"#fff",fontWeight:"bold",fontSize:14,backgroundColor:"rgba(250,250,250,0.3)",padding:3}},{value:'单位40',textStyle:{align:"left"}},{value:'单位50',textStyle:{align:"left"}},{value:'单位60',textStyle:{align:"left"}},{value:'单位分类3',textStyle:{width:150,align:"left",rich:{},color:"#fff",fontWeight:"bold",fontSize:14,backgroundColor:"rgba(250,250,250,0.3)",padding:3}},{value:'单位70',textStyle:{align:"left"}},{value:'单位80',textStyle:{align:"left"}},],yAxisUnit:[{yAxis: "单位分类0"},{yAxis: "单位分类1"},{yAxis: "单位分类2"},{yAxis: "单位分类3"}]},xAxis:{min:-30,max:50,markArea:{nwIsTrue:false,borderColor:"rgba(0,255,91,1)",data: [{startNum:"-15",endNum:"-30",startColor:"rgba(0,0,0,0.0)",endColor:"rgba(0,0,0,0.0)",text:"实际值\n▼"},{startNum:"0",endNum:"-15",startColor:"rgba(0,0,0,0.0)",endColor:"rgba(0,0,0,0.0)",text:"增长\n▼"},{startNum:"0",endNum:"5",startColor:"rgba(255,36,47,0.0)",endColor:"rgba(255,36,47,0.5)",text:"平均值\n▼"},{startNum:"5",endNum:"25",startColor:"rgba(255,250,74,0.0)",endColor:"rgba(255,250,74,0.5)",text:"前25%\n▼"},{startNum:"25",endNum:"40",startColor:"rgba(24,218,250,0.0)",endColor:"rgba(24,218,250,0.5)",text:"世界一流标准前\n12.5%\n▼"},{startNum:"40",endNum:"50",startColor:"rgba(0,255,91,0.0)",endColor:"rgba(0,255,91,0.5)",text:"第一名\n▼"},]},markAreaData:[{xAxis:-30},{xAxis:-15},{xAxis:5},{xAxis:25},{xAxis:40},{xAxis:50}]},seriesData:[{data:[{value :null,ranking:"",Percentage:"",Static:"",symbolSize:0,label: {normal:{}},itemStyle:{}},{value :34,ranking:"排名2",Percentage:"2%",Static:"0",symbolSize:8,label: {normal:{}},itemStyle:{}},{value :32,ranking:"排名3",Percentage:"3%",Static:"0",symbolSize:8,label: {normal:{}},itemStyle:{}},{value :32.5,ranking:"排名4",Percentage:"4%",Static:"0",symbolSize:0,label: {normal:{}},itemStyle:{}},{value :33,ranking:"排名5",Percentage:"5%",Static:"1",symbolSize:8,label: {normal:{}},itemStyle:{}},{value :32,ranking:"排名6",Percentage:"6%",Static:"1",symbolSize:8,label: {normal:{}},itemStyle:{}},{value :28.5,ranking:"",Percentage:"",Static:"",symbolSize:0,label: {normal:{}},itemStyle:{}},{value :25,ranking:"排名8",Percentage:"8%",Static:"1",symbolSize:8,label: {normal:{}},itemStyle:{}},{value :null,ranking:"排名9",Percentage:"9%",Static:"0",symbolSize:0,label: {normal:{}},itemStyle:{}},{value :23,ranking:"排名10",Percentage:"10%",Static:"1",symbolSize:8,label: {normal:{}},itemStyle:{}},{value :null,ranking:"排名11",Percentage:"11%",Static:"0",symbolSize:0,label: {normal:{}},itemStyle:{}},{value :null,ranking:"排名12",Percentage:"12%",Static:"0",symbolSize:8,label: {normal:{}},itemStyle:{}},{value :32,ranking:"排名13",Percentage:"13%",Static:"1",symbolSize:8,label: {normal:{}},itemStyle:{}}],lineColor:"#fff"},{data:[{value:null,ranking:"排名1",Percentage:"1%",Static:"0",symbolSize:0,label: {normal:{}},itemStyle:{}},{value:25,ranking:"排名2",Percentage:"2%",Static:"0",symbolSize:8,label:{normal:{}},itemStyle:{}},{value:20,ranking:"排名3",Percentage:"3%",Static:"1",symbolSize:8,label:{normal:{}},itemStyle:{}},{value:32.5,ranking:"排名4",Percentage:"4%",Static:"0",symbolSize:0,label:{normal:{}},itemStyle:{}},{value:45,ranking:"排名5",Percentage:"5%",Static:"0",symbolSize:8,label:{normal:{}},itemStyle:{}},{value:26,ranking:"排名6",Percentage:"6%",Static:"1",symbolSize:8,label:{normal:{}},itemStyle:{}},{value:26.5,ranking:"排名7",Percentage:"7%",Static:"0",symbolSize:0,label:{normal:{}},itemStyle:{}},{value:27,ranking:"排名8",Percentage:"8%",Static:"1",symbolSize:8,label:{normal:{}},itemStyle:{}},{value:4,ranking:"排名9",Percentage:"9%",Static:"1",symbolSize:8,label:{normal:{}},itemStyle:{}},{value:29,ranking:"排名10",Percentage:"10%",Static:"0",symbolSize:8,label:{normal:{}},itemStyle:{}},{value:27,ranking:"排名11",Percentage:"11%",Static:"0",symbolSize:0,label:{normal:{}},itemStyle:{}},{value:25,ranking:"排名12",Percentage:"12%",Static:"1",symbolSize:8,label:{normal:{}},itemStyle:{}},{value:39,ranking:"排名13",Percentage:"13%",Static:"0",symbolSize:8,label:{normal:{}},itemStyle:{}},],lineColor:"blue"},]}drawLine("main",jsonData)$("#btn1").click(function(){drawLine("main",jsonData)})$("#btn2").click(function(){drawLine("main",jsonOtherData)})});/** drawLine(id,data)* 配置折线属性,默认series至少2组数据,否则无法绘制背景分割背景色和Y轴分割背景色* id:目标id string* data:json*/function drawLine(id,data){var _data=data;//绘制头部var _tipdata=_data.topData;var _html= "<div style='position: absolute;left: 4% ; top: 30px; color:#fff;'>";_html+= " <div style='font-size:12px;'>"+_data.yAxis.name+"</div></div>";_html+= "<div id='topTitle' style='position: absolute;left: 50% ; top: 5px; color:#fff;'>";_html+= " <div id='planTip' style='float:left;'><div style='width:20px;height:8px;background:"+_data.topColor[0]+";border:1px solid "+_data.topColor[1]+"; float:left; margin:7px 5px 0 0 ;'></div><div style='float:left;'>"+_tipdata.planTitle+"</div></div>";_html+= " <div id='lineOneTip' style='float:left;'><div style='width:20px;height:3px;background:"+_data.topColor[2]+"; float:left; margin:10px 5px 0 15px ;'></div><div style='float:left;'>"+_tipdata.planLineOne+"</div></div>";_html+= " <div id='lineTwoTip' style='float:left;'><div style='width:20px;height:3px;background:"+_data.topColor[3]+"; float:left; margin:10px 5px 0 15px ;'></div><div style='float:left;'>"+_tipdata.planLineTwo+"</div></div></div>";// 绘制图表。var myChart = echarts.init(document.getElementById(id));//头部div显示位置$("#topTitle").empty();$(myChart._dom.childNodes[0]).after(_html);//显示隐藏计划值tipif(_tipdata.topPlanTipIsTrue){$("#planTip").css("display","block");}else{$("#planTip").css("display","none");};//tip居中处理var marginLeft=$("#topTitle").width()/2;$("#topTitle").css("margin-left","-"+marginLeft+"px");//echar配置var option = {backgroundColor: _data.backgroundColor,legend: {show:false},tooltip: {show: false,triggerOn: "none"},grid: {left: '200',right: '5%',bottom: '5%',containLabel: false},xAxis: {type: 'value',min: 0,max: 50,boundaryGap: true,axisLabel: {show: false,textStyle: {color:"#fff"}},axisLine: {show: false},axisTick: {show: false},splitLine: {show: false}},yAxis: {type: 'category',inverse: true,boundaryGap: true,axisLine: {show: false,},axisTick: {show: false,alignWithLabel: false},axisLabel: {show: true,margin:155.9,backgroundColor:"rgba(50,50,50,0.3)",textStyle: {color:"#fff"}},axisPointer: {show: true,type: "shadow",label: {show: true}},triggerEvent: true, //坐标轴的标签是否响应和触发鼠标事件,默认不响应data:[]},series: [{name: '数据1',type: 'line',smooth: false,symbol: 'circle',symbolSize: 8,itemStyle:{color:"#18daff"},lineStyle: {normal: {width: 1,color:"#18daff",shadowColor: 'rgba(0,0,0,0.4)',shadowBlur: 10,shadowOffsetY: 10}},connectNulls: false, //开启连接空数据label: {normal: {show: true,color:"#18daff",formatter: '{c}',rich:{},position: 'left' //值显示}},markArea: {data: [[{xAxis: ''}, {xAxis: '',itemStyle: {color: {type: 'linear',x: 0,y: 0,x2: 1,y2: 0,colorStops: [{offset: 0,color: '' // 0% 处的颜色}, {offset: 1,color: '' // 100% 处的颜色}],globalCoord: false // 缺省为 false}}}],[{xAxis: ''}, {xAxis: '',itemStyle: {color: {type: 'linear',x: 0,y: 0,x2: 1,y2: 0,colorStops: [{offset: 0,color: '' // 0% 处的颜色}, {offset: 1,color: '' // 100% 处的颜色}],globalCoord: false // 缺省为 false}}}],[{xAxis: ''}, {xAxis: '',itemStyle: {color: {type: 'linear',x: 0,y: 0,x2: 1,y2: 0,colorStops: [{offset: 0,color: '' // 0% 处的颜色}, {offset: 1,color: '' // 100% 处的颜色}],globalCoord: false // 缺省为 false}}}],[{xAxis: ''}, {xAxis: '',itemStyle: {color: {type: 'linear',x: 0,y: 0,x2: 1,y2: 0,colorStops: [{offset: 0,color: '' // 0% 处的颜色}, {offset: 1,color: '' // 100% 处的颜色}],globalCoord: false // 缺省为 false}}}],[{xAxis: ''}, {xAxis: '',itemStyle: {color: {type: 'linear',x: 0,y: 0,x2: 1,y2: 0,colorStops: [{offset: 0,color: '' // 0% 处的颜色}, {offset: 1,color: '' // 100% 处的颜色}],globalCoord: false // 缺省为 false}}}],[{xAxis: ''}, {xAxis: '',itemStyle: {color: {type: 'linear',x: 0,y: 0,x2: 1,y2: 0,colorStops: [{offset: 0,color: '' // 0% 处的颜色}, {offset: 1,color: '' // 100% 处的颜色}],globalCoord: false // 缺省为 false}}}],]},markLine: {silent: true,symbolSize: 0,label: {position: "start",formatter: function(params) {return ""}},lineStyle: {type: "solid",color: "rgba(250,250,250,0.3)",width: "20"},data: [],rich:{blue: {color: 'blue'},green: {color: 'green'},red: {color: 'red'},white: {color: 'white'}}},data:[]},{name: '数据2',type: 'line',symbol: 'circle',smooth: false,symbolSize: 8,itemStyle:{color:"#fffa4a"},lineStyle: {normal: {width: 1,color:"#fffa4a",shadowColor: 'rgba(0,0,0,0.4)',shadowBlur: 10,shadowOffsetY: 10}},connectNulls: false, //开启连接空数据label: {normal: {show: true,fontSize: 8,formatter: "{c}",rich:{},position: 'right' //值显示}},markLine: {silent: true,symbolSize: 0,label: {position: "start",formatter: function(params) {var value = params.value;return value}},lineStyle: {type: "solid",width: "0",curveness: 1,color:"#fff"},data: []},data:[]},{name:"实际值",type: 'line',symbol: 'circle',smooth: false,symbolSize: 0.00000001,itemStyle:{color:"rgba(0,0,0,0)"},label: {normal: {show: true,color:"green",formatter: '{c}',rich:{},position: 'inside' //值显示}},data:[]},{name:"增长",type: 'line',symbol: 'circle',smooth: false,symbolSize: 0.00000001,itemStyle:{color:"rgba(0,0,0,0)"},label: {normal: {show: true,color:"#fff",formatter: '{c}',rich:{},position: 'inside' //值显示}},data:[]}]};option.yAxis.data=_data.yAxis.data;option.xAxis.min=_data.xAxis.min;option.xAxis.max=_data.xAxis.max;//处理Y轴多列文字显示问题option.series[2].data=_data.yAxisText1;option.series[3].data=_data.yAxisText2;//折线图1option.series[0].name=_tipdata.planLineOne;option.series[0].data=_data.seriesData[0].data;option.series[0].itemStyle.color=_data.seriesData[0].lineColor;option.series[0].lineStyle.normal.color=_data.seriesData[0].lineColor;option.series[0].markLine.data=_data.yAxis.yAxisUnit;for(var j=0;j<_data.xAxis.markArea.data.length;j++){var leng=_data.xAxis.markArea.data.length;var _nwIsTrue=_data.xAxis.markArea.nwIsTrueoption.series[0].markArea.data[j][0].xAxis=_data.xAxis.markArea.data[j].startNum;option.series[0].markArea.data[j][1].xAxis=_data.xAxis.markArea.data[j].endNum;option.series[0].markArea.data[j][1].itemStyle.color.colorStops[0].color=_data.xAxis.markArea.data[j].startColor;option.series[0].markArea.data[j][1].itemStyle.color.colorStops[1].color=_data.xAxis.markArea.data[j].endColor;//是否显示绿色标域的边框if(_nwIsTrue){option.series[0].markArea.data[leng-1][1].itemStyle.color.colorStops[0].color=_data.xAxis.markArea.data[j].endColor;option.series[0].markArea.data[leng-1][1].itemStyle.color.colorStops[1].color=_data.xAxis.markArea.data[j].endColor;option.series[0].markArea.data[leng-1][1].itemStyle.borderWidth="3";option.series[0].markArea.data[leng-1][1].itemStyle.borderColor=_data.xAxis.markArea.borderColor;}}//折线图2option.series[1].name=_tipdata.planLineTwo;option.series[1].data=_data.seriesData[1].data;option.series[1].itemStyle.color=_data.seriesData[1].lineColor;option.series[1].lineStyle.normal.color=_data.seriesData[1].lineColor;option.series[1].markLine.data=data.xAxis.markAreaData;option.series[1].markLine.label.formatter=function(params){var value = params.value;var y_val0=_data.xAxis.markArea.data[0].endNum;var y_text0=_data.xAxis.markArea.data[0].text;var y_val1=_data.xAxis.markArea.data[1].endNum;var y_text1=_data.xAxis.markArea.data[1].text;var _val0=_data.xAxis.markArea.data[2].endNum;var _text0=_data.xAxis.markArea.data[2].text;var _val1=_data.xAxis.markArea.data[3].endNum;var _text1=_data.xAxis.markArea.data[3].text;var _val2=_data.xAxis.markArea.data[4].endNum;var _text2=_data.xAxis.markArea.data[4].text;var _val3=_data.xAxis.markArea.data[5].endNum;var _text3=_data.xAxis.markArea.data[5].text;//处理顶部标文字if(value == y_val0){value = "{white|"+y_text0+"}"}else if(value == y_val1){value = "{white|"+y_text1+"}"}else if(value == _val0) {value = "{blue|"+_text0+"}"} else if(value == _val1) {value = "{green|"+_text1+"}"} else if(value ==_val2) {value = "{red|"+_text2+"}"} else if(value == _val3) {value = "{white|"+_text3+"}"}return value}option.series[1].markLine.label.rich={blue: {color: 'blue'},green: {color: 'green'},red: {color: 'red'},white: {color: 'white'}}//可通过谋属性或者值来格式化点上的文字,颜色,位置if(true){for(var n=0;n<2;n++){var val1=[],val2=[];//处理折线1上的点的大小,颜色问题option.series[0].label.normal.position="left";option.series[0].data.forEach(function(value,index,array){// console.log(value)var _val=value.value;val1.push(_val);var _symbolSize=value.symbolSize;if(_val>0 && _val<5 && _symbolSize!=0){value.itemStyle.color="red";value.label.normal.position="left";value.symbolSize=15;}else if(_val>5 && _val<25 && _symbolSize!=0){}else if(_val>25 && _val<40 && _symbolSize!=0){}else if(_val>40 && _val<50 && _symbolSize!=0){value.itemStyle.color="green";value.label.normal.position="right";value.symbolSize=15}});//处理折线2上的点的大小,颜色问题option.series[1].label.normal.position="right";option.series[1].data.forEach(function(value,index,array){var _val=value.value;val2.push(_val);var _symbolSize=value.symbolSize;if(_val>0 && _val<5 && _symbolSize!=0){value.itemStyle.color="red";value.label.normal.position="top";value.symbolSize=15;}else if(_val>5 && _val<25 && _symbolSize!=0){}else if(_val>25 && _val<40 && _symbolSize!=0){}else if(_val>40 && _val<50 && _symbolSize!=0){value.itemStyle.color="green";value.label.normal.position="right";value.symbolSize=15}});//处理2组数据点上文字左右的排布问题var _length=val1.lengthif(_length==val2.length){for(var i = 0; i < _length; i++) {if(val1[i] <= val2[i]) {option.series[0].data[i].label.normal.position="left";if(option.series[0].data[i].itemStyle.color=="red"){option.series[0].data[i].label.normal.position="right";}option.series[1].data[i].label.normal.position="right";}else {option.series[0].data[i].label.normal.position="right";option.series[1].data[i].label.normal.position="left";}}}//格式化点上文字描述option.series[n].label.normal.formatter=function(params){//console.log(params.data)var _val=params.value;var _symbolSize=params.data.symbolSize;var _ranking=params.data.ranking;var _Static=params.data.Static;var _Percentage=params.data.Percentage;var text = "";var _color="";if(_Static==0){_Static="↓"_color="red";}else{_Static="↑"_color="green";};if(_symbolSize != 0) {text = "{white|"+_ranking+"} {blue|"+_val+"}\n{"+_color+"|"+_Static+_Percentage+"}"}return text};option.series[n].label.normal.rich={blue: {color: 'blue'},green: {color: 'green'},red: {color: 'red'},white: {color: 'white'}};}}//格式化Y轴多列文字option.series[2].label.normal.formatter=function(params){var _val = params.data.value;var _text = params.data.text;var _upIsTrue = params.data.upIsTrue;var _color = "green";if(_upIsTrue){_color = "green";}else{_color = "red";};_text = "{"+_color+"|"+_text+"}"return _text}option.series[2].label.normal.rich={green: {color: 'green'},red: {color: 'red'}};option.series[3].label.normal.formatter=function(params){var _val = params.data.value;var _text = params.data.text;return _text}//绘制图myChart.setOption(option, true);//点击事件// myChart.on('click', function (params) {// //点击Y轴上的文字 注意给对应的Y轴开启:triggerEvent:true// if(params.componentType=="yAxis" && params.yAxisIndex=="0"){// if(params.value=="单位00"){// option.series[0].data=[34,32,null,33,35,null,39,33,38,null, 39,35]// }else{// option.series[0].data=[14,12,null,13,15,null,19,13,18,null, 19,15]// }// option.yAxis.axisPointer.value=params.value;// myChart.setOption(option,true);// }// });}</script>
DOME下载
本文为原创文章,转载请附上原文链接!

若有收获,就点个赞吧
0 人点赞
