说明
要求做立体感环形饼图
示例图
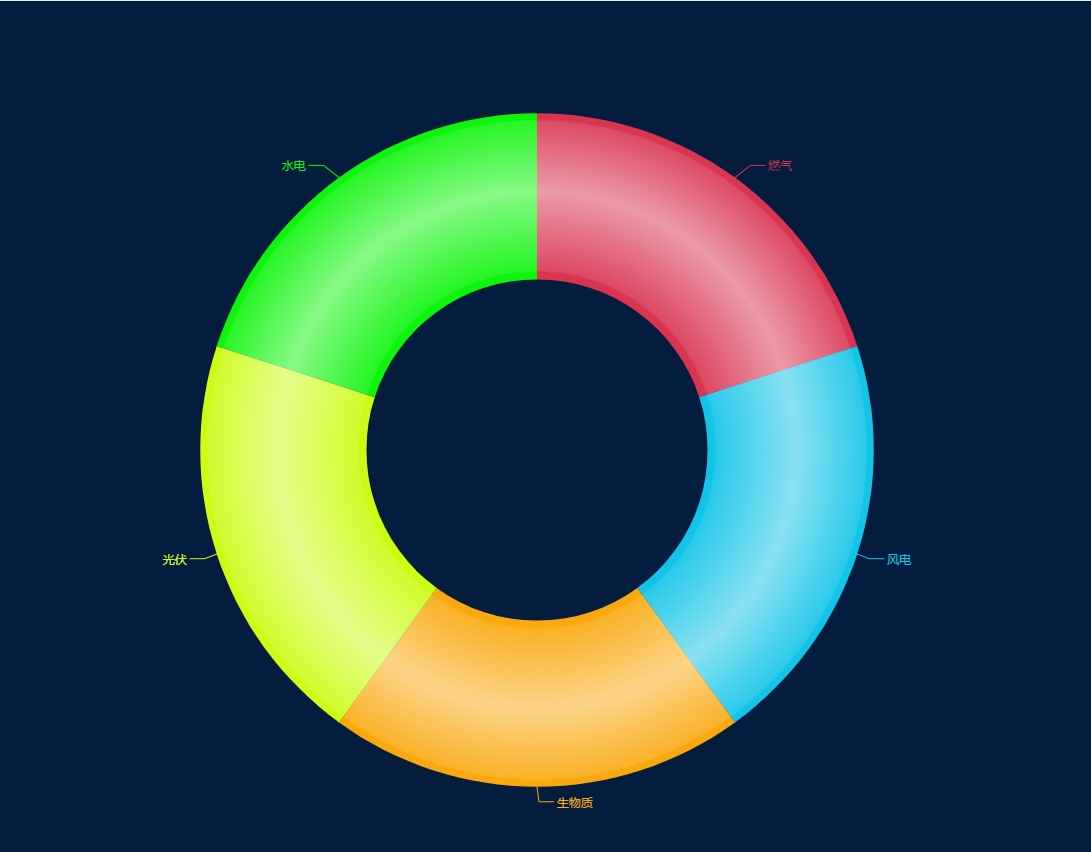
HTML代码
<div id="main" style="width: 50%;height:400px;margin: 0 auto;"></div>
JS代码
<script src="js/jquery-1.6.2.min.js"></script><script src="js/echarts.min.js"></script><script>$(function () {pie("main");});/*** @func* @desc 立体感饼图函数* @param {string} id - string |目标id**/function pie(id){var myChart = echarts.init(document.getElementById(id));var option = {backgroundColor:"#041c3e",tooltip: {trigger: "item"},series: [{name: "",type: "pie",radius: ["38%","75%"],z: 0,zlevel: 0,label: {normal: {show: true, position: "outside"} },hoverAnimation:false,itemStyle:{emphasis:{opacity:.7}},data: [{value: 30, name: "燃气", itemStyle: {normal: {color: "#d93551"} } },{value: 30, name: "风电", itemStyle: {normal: {color: "#12c4e7"} } },{value: 30, name: "生物质", itemStyle: {normal: {color: "#f9a90f"} } },{value: 30, name: "光伏", itemStyle: {normal: {color: "#ccfc15"} } },{value: 30, name: "水电", itemStyle: {normal: {color: "#0ef40d"} } }]},{name: "",type: "pie",radius: ["38%","75%"],silent: true,z: 0,zlevel: 0,label: {normal: {show: false, position: "center"} },data: [{value: 1, name: "", itemStyle: {normal: {color: {type: 'radial',x: 0.5,y: 0.5,r: 0.7,colorStops: [{offset: 0, color: 'transparent'},{offset: 0.379999, color: 'transparent'},{offset: 0.38, color: 'rgba(255,255,255,0.1)'},{offset: 0.55, color: 'rgba(255,255,255,0.5)'},{offset: 0.699999, color: 'rgba(255,255,255,0.1)'},{offset: 0.7, color: 'transparent'},{offset: 1, color: 'transparent'}],globalCoord: false // 缺省为 false}} } }]}]}// 画图myChart.setOption(option,true);myChart.resize();}</script>
本文为原创文章,转载请附上原文链接!

若有收获,就点个赞吧
0 人点赞
