本文我们就将在 Kubernetes 集群中使用由 ElasticSearch、Kibana、Filebeat、Metricbeat 和 APM-Server 组成的 Elastic 技术栈来监控系统环境。
- 监控指标提供系统各个组件的时间序列数据,比如 CPU、内存、磁盘、网络等信息,通常可以用来显示系统的整体状况以及检测某个时间的异常行为
- 日志为运维人员提供了一个数据来分析系统的一些错误行为,通常将系统、服务和应用的日志集中收集在同一个数据库中
- 追踪或者 APM(应用性能监控)提供了一个更加详细的应用视图,可以将服务执行的每一个请求和步骤都记录下来(比如 HTTP 调用、数据库查询等),通过追踪这些数据,我们可以检测到服务的性能,并相应地改进或修复我们的系统。
我们这里的试验环境是 Kubernetes v1.16.2 版本的集群,为方便管理,我们将所有的资源对象都部署在一个名为 elastic 的命名空间中:
$ kubectl create ns elasticnamespace/elastic created
1、搭建ES集群
要建立一个 Elastic 技术的监控栈,当然首先我们需要部署 ElasticSearch,它是用来存储所有的指标、日志和追踪的数据库,这里我们通过3个不同角色的可扩展的节点组成一个集群。
2.1 安装 ElasticSearch 主节点
设置集群的第一个节点为 Master 主节点,来负责控制整个集群。
- 首先创建一个 ConfigMap 对象,用来描述集群的一些配置信息,以方便将 ElasticSearch 的主节点配置到集群中并开启安全认证功能。
- 然后创建一个 Service 对象,在 Master 节点下,我们只需要通过用于集群通信的 9300 端口进行通信。
- 最后使用一个 Deployment 对象来定义 Master 节点应用。
# elasticsearch-master.configmap.yaml---apiVersion: v1kind: ConfigMapmetadata:name: elasticsearch-master-configlabels:app: elasticsearchrole: masterdata:elasticsearch.yml: |-cluster.name: ${CLUSTER_NAME}node.name: ${NODE_NAME}discovery.seed_hosts: ${NODE_LIST}cluster.initial_master_nodes: ${MASTER_NODES}network.host: 0.0.0.0node:master: truedata: falseingest: falsexpack.security.enabled: truexpack.monitoring.collection.enabled: true---# elasticsearch-master.service.yaml---apiVersion: v1kind: Servicemetadata:name: elasticsearch-masterlabels:app: elasticsearchrole: masterspec:ports:- port: 9300name: transportselector:app: elasticsearchrole: master---# elasticsearch-master.deployment.yaml---apiVersion: apps/v1kind: Deploymentmetadata:name: elasticsearch-masterlabels:app: elasticsearchrole: masterspec:replicas: 1selector:matchLabels:app: elasticsearchrole: mastertemplate:metadata:labels:app: elasticsearchrole: masterspec:containers:- name: elasticsearch-masterimage: docker.elastic.co/elasticsearch/elasticsearch:7.8.0env:- name: CLUSTER_NAMEvalue: elasticsearch- name: NODE_NAMEvalue: elasticsearch-master- name: NODE_LISTvalue: elasticsearch-master,elasticsearch-data,elasticsearch-client- name: MASTER_NODESvalue: elasticsearch-master- name: "ES_JAVA_OPTS"value: "-Xms512m -Xmx512m"ports:- containerPort: 9300name: transportvolumeMounts:- name: configmountPath: /usr/share/elasticsearch/config/elasticsearch.ymlreadOnly: truesubPath: elasticsearch.yml- name: storagemountPath: /datavolumes:- name: configconfigMap:name: elasticsearch-master-config- name: "storage"emptyDir:medium: ""
注:
为何在cm中要定义kv值,且deploy文件里又定义了相同的环境变量?
为何要挂载个临时卷 /data
2.2 安装 ElasticSearch 数据节点
- 和 master 节点一样,我们使用一个 ConfigMap 对象来配置我们的数据节点.
- 可以看到和上面的 master 配置非常类似,不过需要注意的是属性 node.data=true。
- 同样只需要通过 9300 端口和其他节点进行通信.
- 最后创建一个 StatefulSet 的控制器,因为可能会有多个数据节点,每一个节点的数据不是一样的,需要单独存储,所以也使用了一个 volumeClaimTemplates 来分别创建存储卷,对应的资源清单文件如下所示:
# elasticsearch-data.configmap.yaml---apiVersion: v1kind: ConfigMapmetadata:name: elasticsearch-data-configlabels:app: elasticsearchrole: datadata:elasticsearch.yml: |-cluster.name: ${CLUSTER_NAME}node.name: ${NODE_NAME}discovery.seed_hosts: ${NODE_LIST}cluster.initial_master_nodes: ${MASTER_NODES}network.host: 0.0.0.0node:master: falsedata: trueingest: falsexpack.security.enabled: truexpack.monitoring.collection.enabled: true# elasticsearch-data.service.yaml---apiVersion: v1kind: Servicemetadata:name: elasticsearch-datalabels:app: elasticsearchrole: dataspec:ports:- port: 9300name: transportselector:app: elasticsearchrole: data---# elasticsearch-data.statefulset.yaml---apiVersion: apps/v1kind: StatefulSetmetadata:name: elasticsearch-datalabels:app: elasticsearchrole: dataspec:serviceName: "elasticsearch-data"selector:matchLabels:app: elasticsearchrole: datatemplate:metadata:labels:app: elasticsearchrole: dataspec:containers:- name: elasticsearch-dataimage: docker.elastic.co/elasticsearch/elasticsearch:7.8.0env:- name: CLUSTER_NAMEvalue: elasticsearch- name: NODE_NAMEvalue: elasticsearch-data- name: NODE_LISTvalue: elasticsearch-master,elasticsearch-data,elasticsearch-client- name: MASTER_NODESvalue: elasticsearch-master- name: "ES_JAVA_OPTS"value: "-Xms1024m -Xmx1024m"ports:- containerPort: 9300name: transportvolumeMounts:- name: configmountPath: /usr/share/elasticsearch/config/elasticsearch.ymlreadOnly: truesubPath: elasticsearch.yml- name: elasticsearch-data-persistent-storagemountPath: /data/dbvolumes:- name: configconfigMap:name: elasticsearch-data-configvolumeClaimTemplates:- metadata:name: elasticsearch-data-persistent-storagespec:accessModes: [ "ReadWriteOnce" ]storageClassName: general-cinderresources:requests:storage: 50Gi---
注:
sts挂载静态存储时,需要预先创建一个sc。比如general-cinder
2.3 安装 ElasticSearch 客户端节点
最后来安装配置 ElasticSearch 的客户端节点,该节点主要负责暴露一个 HTTP 接口将查询数据传递给数据节点获取数据。
- 同样使用一个 ConfigMap 对象来配置该节点
- 客户端节点需要暴露两个端口,9300端口用于与集群的其他节点进行通信,9200端口用于 HTTP API。对应的 Service 对象如下所示
- 使用一个 Deployment 对象来描述客户端节点
# elasticsearch-client.configmap.yaml---apiVersion: v1kind: ConfigMapmetadata:name: elasticsearch-client-configlabels:app: elasticsearchrole: clientdata:elasticsearch.yml: |-cluster.name: ${CLUSTER_NAME}node.name: ${NODE_NAME}discovery.seed_hosts: ${NODE_LIST}cluster.initial_master_nodes: ${MASTER_NODES}network.host: 0.0.0.0node:master: falsedata: falseingest: truexpack.security.enabled: truexpack.monitoring.collection.enabled: true---# elasticsearch-client.service.yaml---apiVersion: v1kind: Servicemetadata:name: elasticsearch-clientlabels:app: elasticsearchrole: clientspec:ports:- port: 9200name: client- port: 9300name: transportselector:app: elasticsearchrole: client---# elasticsearch-client.deployment.yaml---apiVersion: apps/v1kind: Deploymentmetadata:name: elasticsearch-clientlabels:app: elasticsearchrole: clientspec:selector:matchLabels:app: elasticsearchrole: clienttemplate:metadata:labels:app: elasticsearchrole: clientspec:containers:- name: elasticsearch-clientimage: docker.elastic.co/elasticsearch/elasticsearch:7.8.0env:- name: CLUSTER_NAMEvalue: elasticsearch- name: NODE_NAMEvalue: elasticsearch-client- name: NODE_LISTvalue: elasticsearch-master,elasticsearch-data,elasticsearch-client- name: MASTER_NODESvalue: elasticsearch-master- name: "ES_JAVA_OPTS"value: "-Xms256m -Xmx256m"ports:- containerPort: 9200name: client- containerPort: 9300name: transportvolumeMounts:- name: configmountPath: /usr/share/elasticsearch/config/elasticsearch.ymlreadOnly: truesubPath: elasticsearch.yml- name: storagemountPath: /datavolumes:- name: configconfigMap:name: elasticsearch-client-config- name: "storage"emptyDir:medium: ""---
2.4 生成密码
我们启用了 xpack 安全模块来保护我们的集群,所以我们需要一个初始化的密码。我们可以执行如下所示的命令,在客户端节点容器内运行 bin/elasticsearch-setup-passwords 命令来生成默认的用户名和密码:
[root@elasticsearch-client-6fb8994f4b-p7r6f elasticsearch]# bin/elasticsearch-setup-passwords auto -bYour cluster health is currently RED.This means that some cluster data is unavailable and your cluster is not fully functional.It is recommended that you resolve the issues with your cluster before running elasticsearch-setup-passwords.It is very likely that the password changes will fail when run against an unhealthy cluster.Changed password for user apm_systemPASSWORD apm_system = IzRO5ghRqr4tb8JMHcxQChanged password for user kibana_systemPASSWORD kibana_system = ixpkrMfUXtieWPIFv6sBChanged password for user kibanaPASSWORD kibana = ixpkrMfUXtieWPIFv6sBChanged password for user logstash_systemPASSWORD logstash_system = 9pIv0jWRzogSJvE2QCRUChanged password for user beats_systemPASSWORD beats_system = YguqwhBTXBqU3osiOPiBChanged password for user remote_monitoring_userPASSWORD remote_monitoring_user = 1uh95KrodBGsncpCXX6lChanged password for user elasticPASSWORD elastic = paxu3UgBJcPVHY9b4tQD
注意需要将 elastic 用户名和密码也添加到 Kubernetes 的 Secret 对象中:
$ kubectl create secret generic es-pwd \-n elastic \--from-literal password=paxu3UgBJcPVHY9b4tQDsecret/es-pwd created
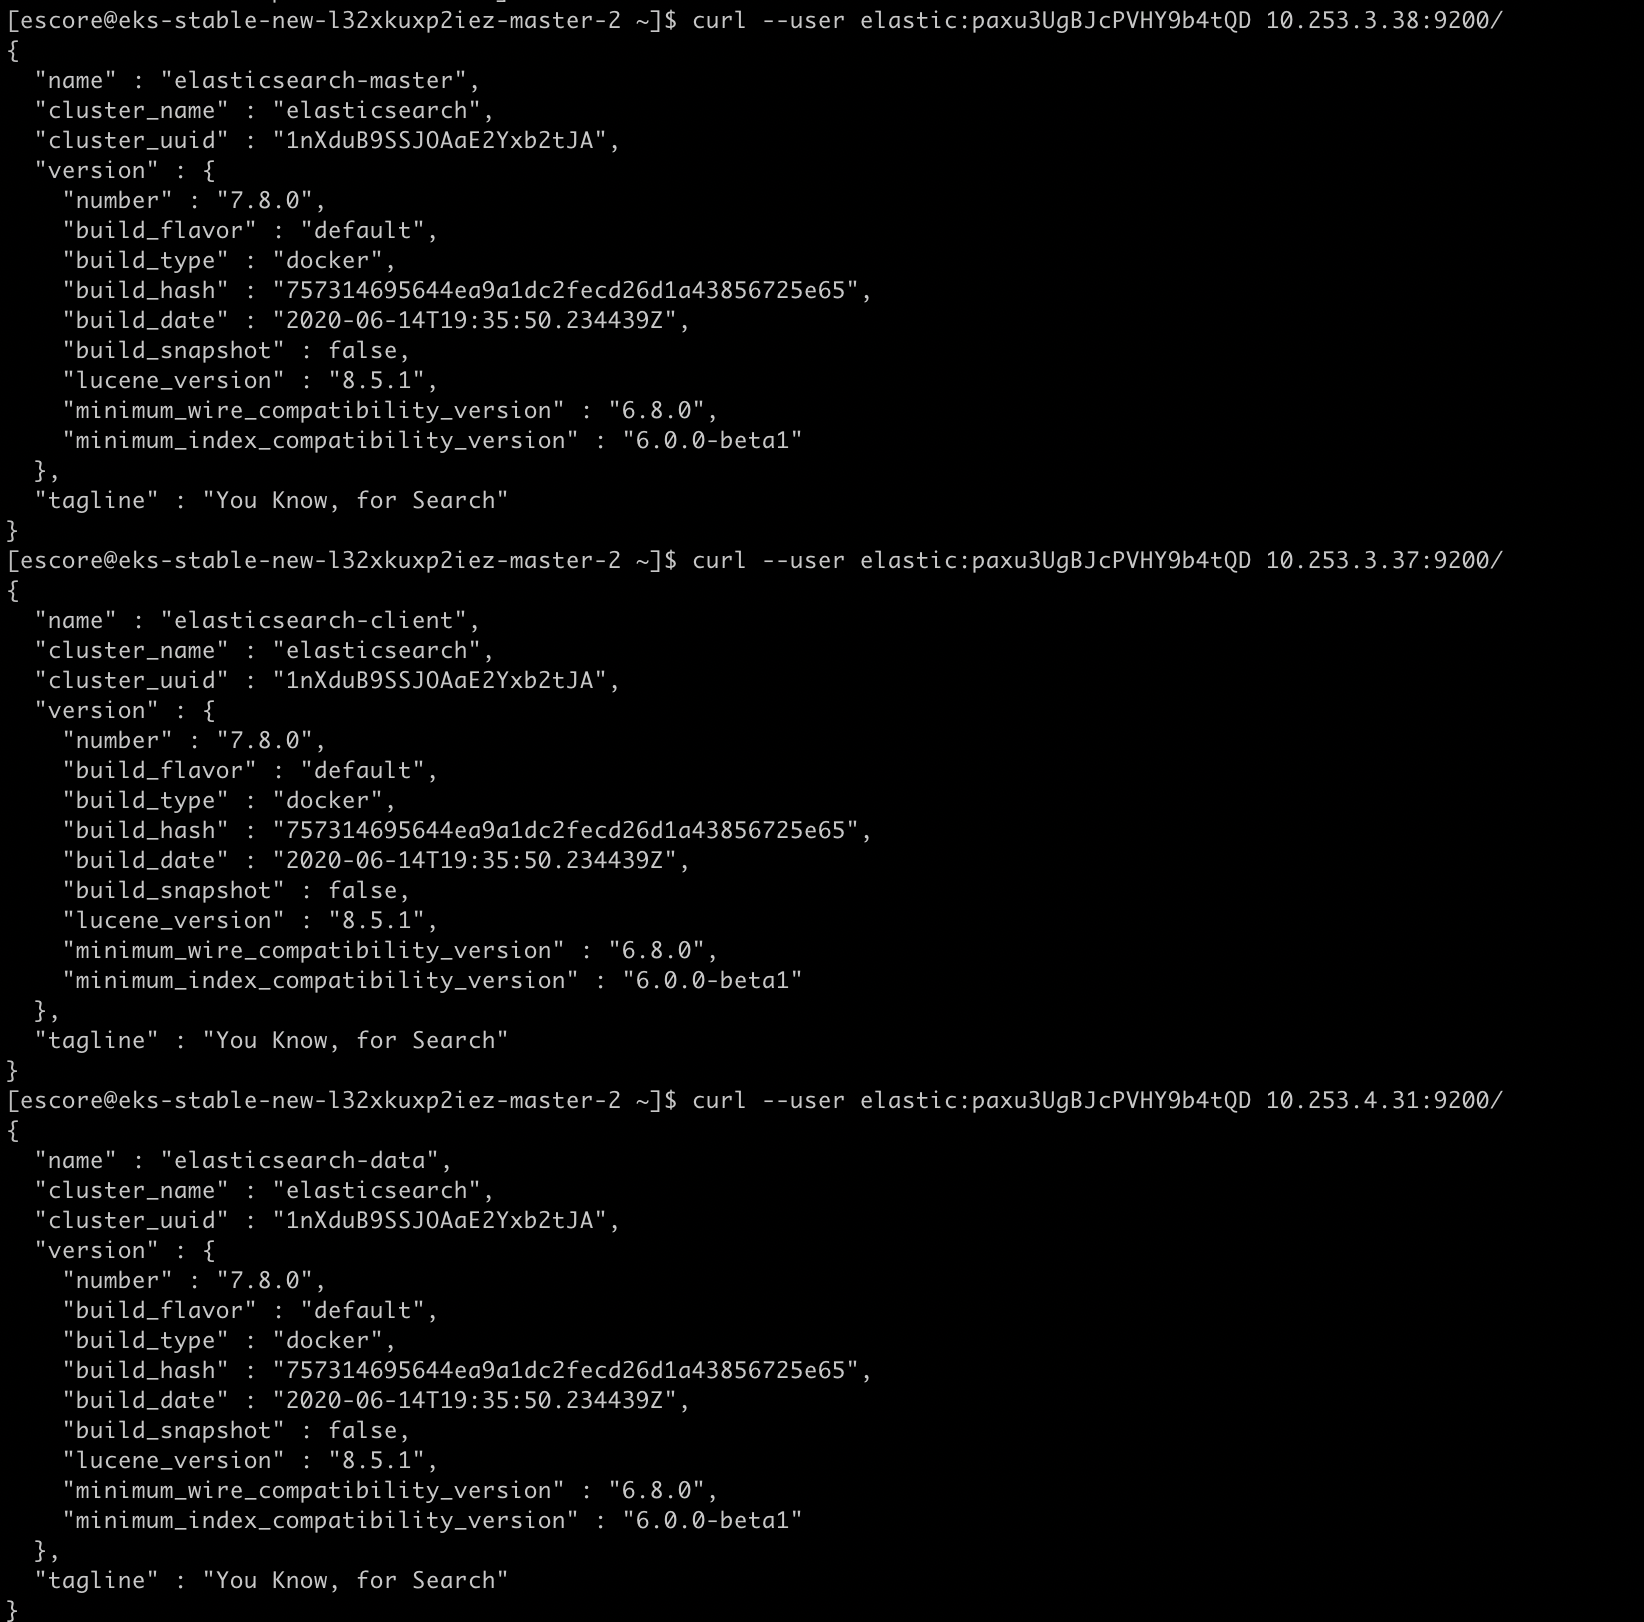
2.5 验证集群搭建成功
验证集群状态为绿色,健康状态。
$ kubectl get pods -n elastic -l app=elasticsearchNAME READY STATUS RESTARTS AGEelasticsearch-client-6fb8994f4b-vx7lf 1/1 Running 0 5d12helasticsearch-data-0 1/1 Running 0 5d12helasticsearch-master-6764787d9f-k2wwq 1/1 Running 0 5d12h# 查看集群的状态变化$ kubectl logs -f -n elastic $(kubectl get pods -n elastic | grep elasticsearch-master | sed -n 1p | awk '{print $1}') | grep "Cluster health status changed from"{"type": "server", "timestamp": "2021-09-15T18:59:05,442Z", "level": "INFO", "component": "o.e.c.r.a.AllocationService", "cluster.name": "elasticsearch", "node.name": "elasticsearch-master", "message": "Cluster health status changed from [YELLOW] to [GREEN] (reason: [shards started [[.monitoring-es-7-2021.09.15][0]]]).", "cluster.uuid": "BXZj294tQsCwvZUrAGXBVg", "node.id": "OmSHMrkdTKaeX-bN-5r9Mg" }{"type": "server", "timestamp": "2021-09-15T18:59:06,386Z", "level": "INFO", "component": "o.e.c.r.a.AllocationService", "cluster.name": "elasticsearch", "node.name": "elasticsearch-master", "message": "Cluster health status changed from [YELLOW] to [GREEN] (reason: [shards started [[.security-7][0]]]).", "cluster.uuid": "BXZj294tQsCwvZUrAGXBVg", "node.id": "OmSHMrkdTKaeX-bN-5r9Mg" }{"type": "server", "timestamp": "2021-09-15T19:01:20,525Z", "level": "INFO", "component": "o.e.c.r.a.AllocationService", "cluster.name": "elasticsearch", "node.name": "elasticsearch-master", "message": "Cluster health status changed from [YELLOW] to [GREEN] (reason: [shards started [[.kibana_1][0]]]).", "cluster.uuid": "BXZj294tQsCwvZUrAGXBVg", "node.id": "OmSHMrkdTKaeX-bN-5r9Mg" }{"type": "server", "timestamp": "2021-09-15T19:01:22,344Z", "level": "INFO", "component": "o.e.c.r.a.AllocationService", "cluster.name": "elasticsearch", "node.name": "elasticsearch-master", "message": "Cluster health status changed from [YELLOW] to [GREEN] (reason: [shards started [[.kibana-event-log-7.8.0-000001][0]]]).", "cluster.uuid": "BXZj294tQsCwvZUrAGXBVg", "node.id": "OmSHMrkdTKaeX-bN-5r9Mg" }{"type": "server", "timestamp": "2021-09-15T19:01:23,260Z", "level": "INFO", "component": "o.e.c.r.a.AllocationService", "cluster.name": "elasticsearch", "node.name": "elasticsearch-master", "message": "Cluster health status changed from [YELLOW] to [GREEN] (reason: [shards started [[ilm-history-2-000001][0]]]).", "cluster.uuid": "BXZj294tQsCwvZUrAGXBVg", "node.id": "OmSHMrkdTKaeX-bN-5r9Mg" }{"type": "server", "timestamp": "2021-09-15T19:01:23,890Z", "level": "INFO", "component": "o.e.c.r.a.AllocationService", "cluster.name": "elasticsearch", "node.name": "elasticsearch-master", "message": "Cluster health status changed from [YELLOW] to [GREEN] (reason: [shards started [[.apm-custom-link][0]]]).", "cluster.uuid": "BXZj294tQsCwvZUrAGXBVg", "node.id": "OmSHMrkdTKaeX-bN-5r9Mg" }{"type": "server", "timestamp": "2021-09-15T19:01:33,042Z", "level": "INFO", "component": "o.e.c.r.a.AllocationService", "cluster.name": "elasticsearch", "node.name": "elasticsearch-master", "message": "Cluster health status changed from [YELLOW] to [GREEN] (reason: [shards started [[.monitoring-kibana-7-2021.09.15][0]]]).", "cluster.uuid": "BXZj294tQsCwvZUrAGXBVg", "node.id": "OmSHMrkdTKaeX-bN-5r9Mg" }
[escore@eks-stable-new-l32xkuxp2iez-master-2 ~]$ curl --user elastic:paxu3UgBJcPVHY9b4tQD 10.253.4.31:9200/_cat/health1632332525 17:42:05 elasticsearch green 3 1 2 2 0 0 0 0 - 100.0%
- status:集群的状态,red红表示集群不可用,有故障。yellow黄表示集群不可靠但可用,一般单节点时就是此状态。green正常状态,表示集群一切正常。
- node.total:节点数,这里是3,表示该集群有3个节点
- node.data:数据节点数,存储数据的节点数,这里是3
- shards:表示我们把数据分成多少块存储
- pri:主分片数,primary shards
- active_shards_percent:激活的分片百分比,这里可以理解为加载的数据分片数,只有加载所有的分片数,集群才算正常启动,在启动的过程中,如果我们不断刷新这个页面,我们会发现这个百分比不断加大
2、配置kibanna
- 首先我们使用 ConfigMap 对象来提供一个文件,其中包括对 ElasticSearch 的访问(主机、用户名和密码),这些都是通过环境变量配置的
- 然后通过一个 NodePort 类型的服务来暴露 Kibana 服务
- 最后通过 Deployment 来部署 Kibana 服务,由于需要通过环境变量提供密码,这里我们使用上面创建的 Secret 对象来引用:
```
kibana.configmap.yaml
apiVersion: v1 kind: ConfigMap metadata: name: kibana-config labels: app: kibana data: kibana.yml: |- server.host: 0.0.0.0
elasticsearch:hosts: ${ELASTICSEARCH_HOSTS}username: ${ELASTICSEARCH_USER}password: ${ELASTICSEARCH_PASSWORD}
kibana.service.yaml
apiVersion: v1 kind: Service metadata: name: kibana labels: app: kibana spec: type: NodePort ports:
- port: 5601 name: webinterface selector: app: kibana
kibana.deployment.yaml
apiVersion: apps/v1 kind: Deployment metadata: name: kibana labels: app: kibana spec: selector: matchLabels: app: kibana template: metadata: labels: app: kibana spec: containers:
- name: kibanaimage: docker.elastic.co/kibana/kibana:7.8.0ports:- containerPort: 5601name: webinterfaceenv:- name: ELASTICSEARCH_HOSTSvalue: "http://elasticsearch-client.elastic.svc.cluster.local:9200"- name: ELASTICSEARCH_USERvalue: "elastic"- name: ELASTICSEARCH_PASSWORDvalueFrom:secretKeyRef:name: es-pwdkey: passwordvolumeMounts:- name: configmountPath: /usr/share/kibana/config/kibana.ymlreadOnly: truesubPath: kibana.ymlvolumes:- name: configconfigMap:name: kibana-config
部署成功后,可以通过查看 Pod 的日志来了解 Kibana 的状态:```yaml[escore@eks-stable-new-l32xkuxp2iez-master-2 ~]$ kubectl logs -f -n elastic $(kubectl get pods -n elastic | grep kibana | sed -n 1p | awk '{print $1}') | grep "Status changed from yellow to green"{"type":"log","@timestamp":"2021-09-22T17:58:40Z","tags":["status","plugin:elasticsearch@7.8.0","info"],"pid":7,"state":"green","message":"Status changed from yellow to green - Ready","prevState":"yellow","prevMsg":"Waiting for Elasticsearch"}
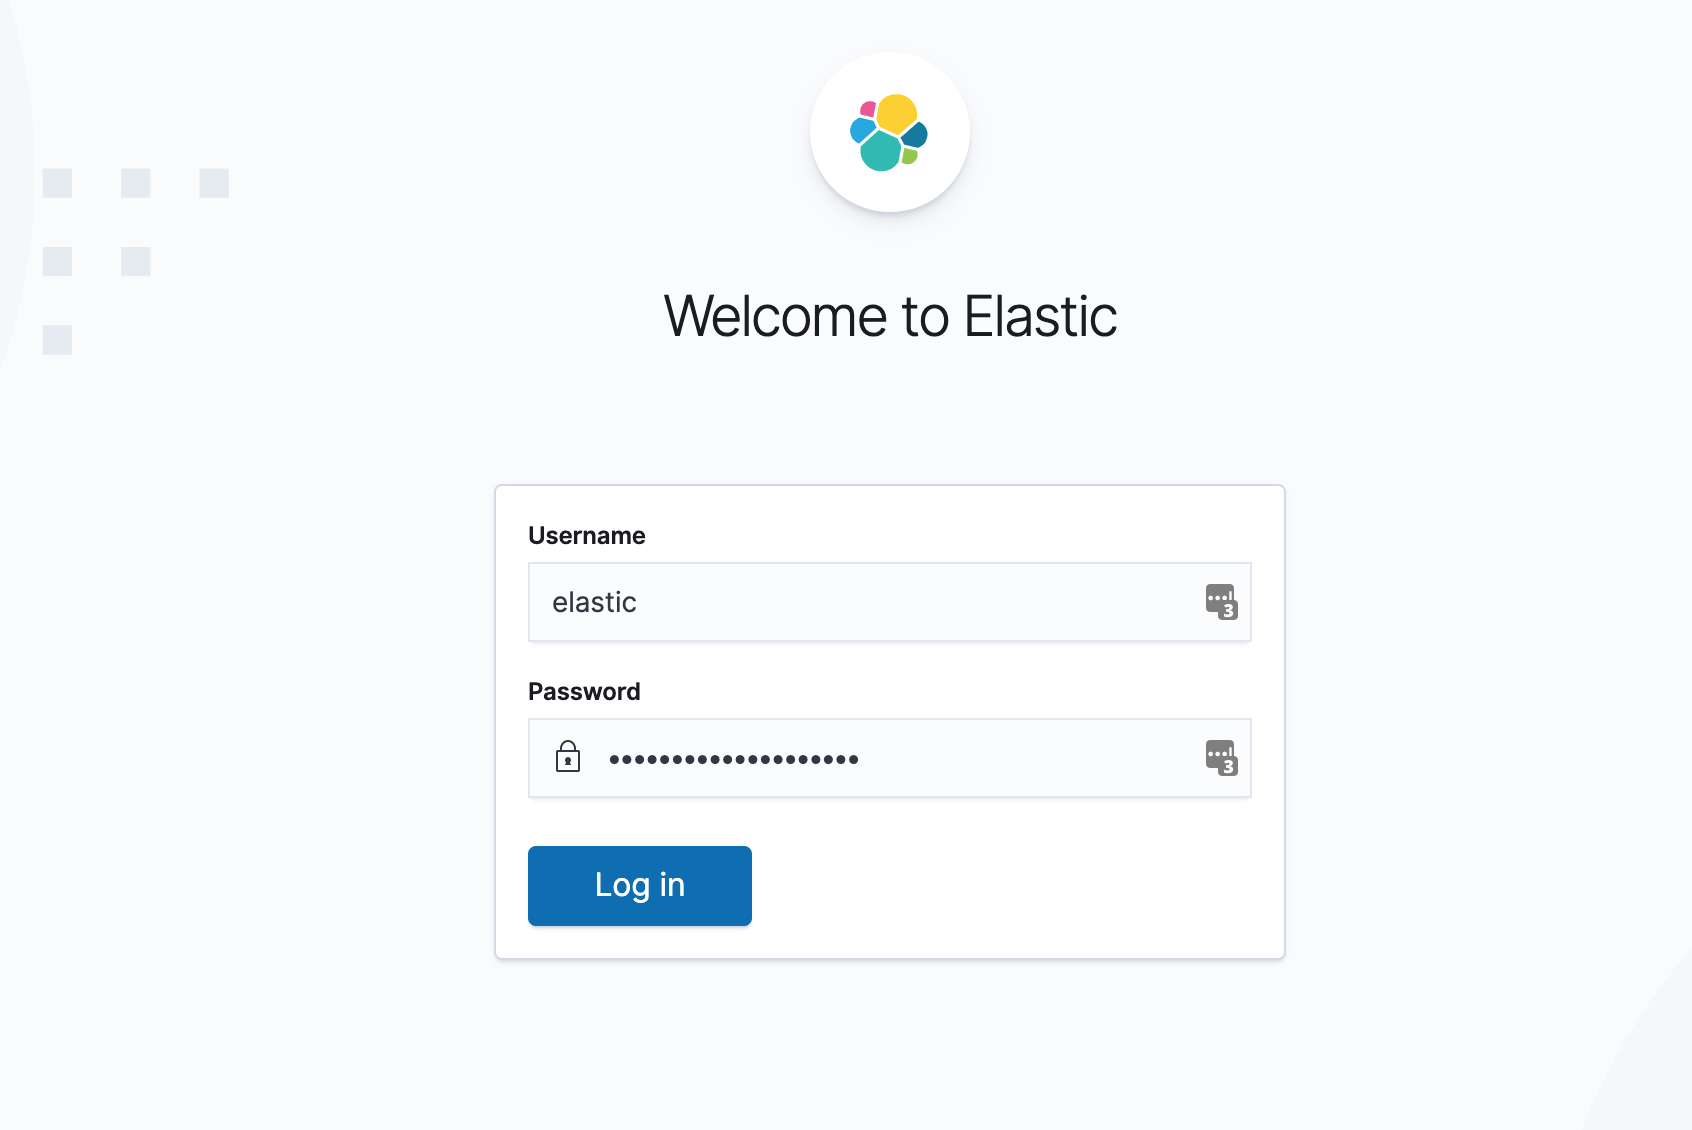
2.1 访问kibanna
如下图所示,使用上面我们创建的 Secret 对象的 elastic 用户和生成的密码即可登录:
到这里我们就安装成功了 ElasticSearch 与 Kibana,它们将为我们来存储和可视化我们的应用数据(监控指标、日志和追踪)服务。最后还可以通过 Management → Stack Monitoring 页面查看整个集群的健康状态:

3、配置filebeat
安装配置 Filebeat 来收集 Kubernetes 集群中的日志数据,然后发送到 ElasticSearch 去中,Filebeat 是一个轻量级的日志采集代理,还可以配置特定的模块来解析和可视化应用(比如数据库、Nginx 等)的日志格式。
Filebeat 也需要一个配置文件来设置和 ElasticSearch 的链接信息、和 Kibana 的连接已经日志采集和解析的方式。
- 配置采集 /var/log/containers/ 下面的所有日志数据,并且使用 inCluster 的模式访问 Kubernetes 的 APIServer,获取日志数据的 Meta 信息,将日志直接发送到 Elasticsearch。
- 此外还通过 policy_file 定义了 indice 的回收策略
- RBAC权限
# filebeat.settings.configmap.yml---apiVersion: v1kind: ConfigMapmetadata:name: filebeat-configlabels:app: filebeatdata:filebeat.yml: |-filebeat.inputs:- type: containerenabled: truepaths:- /var/log/containers/*.logprocessors:- add_kubernetes_metadata:in_cluster: truehost: ${NODE_NAME}matchers:- logs_path:logs_path: "/var/log/containers/"filebeat.autodiscover:providers:- type: kubernetestemplates:- condition.equals:kubernetes.labels.app: mongoconfig:- module: mongodbenabled: truelog:input:type: dockercontainers.ids:- ${data.kubernetes.container.id}processors:- drop_event:when.or:- and:- regexp:message: '^\d+\.\d+\.\d+\.\d+ '- equals:fileset.name: error- and:- not:regexp:message: '^\d+\.\d+\.\d+\.\d+ '- equals:fileset.name: access- add_cloud_metadata:- add_kubernetes_metadata:matchers:- logs_path:logs_path: "/var/log/containers/"- add_docker_metadata:output.elasticsearch:hosts: ['${ELASTICSEARCH_HOST:elasticsearch}:${ELASTICSEARCH_PORT:9200}']username: ${ELASTICSEARCH_USERNAME}password: ${ELASTICSEARCH_PASSWORD}setup.kibana:host: '${KIBANA_HOST:kibana}:${KIBANA_PORT:5601}'setup.dashboards.enabled: truesetup.template.enabled: truesetup.ilm:policy_file: /etc/indice-lifecycle.json---# filebeat.indice-lifecycle.configmap.yml---apiVersion: v1kind: ConfigMapmetadata:name: filebeat-indice-lifecyclelabels:app: filebeatdata:indice-lifecycle.json: |-{"policy": {"phases": {"hot": {"actions": {"rollover": {"max_size": "5GB" ,"max_age": "1d"}}},"delete": {"min_age": "30d","actions": {"delete": {}}}}}}---#filebeat.daemonset.yml---apiVersion: apps/v1kind: DaemonSetmetadata:name: filebeatlabels:app: filebeatspec:selector:matchLabels:app: filebeattemplate:metadata:labels:app: filebeatspec:serviceAccountName: filebeatterminationGracePeriodSeconds: 30containers:- name: filebeatimage: docker.elastic.co/beats/filebeat:7.8.0args: ["-c", "/etc/filebeat.yml","-e",]env:- name: ELASTICSEARCH_HOSTvalue: elasticsearch-client.elastic.svc.cluster.local- name: ELASTICSEARCH_PORTvalue: "9200"- name: ELASTICSEARCH_USERNAMEvalue: elastic- name: ELASTICSEARCH_PASSWORDvalueFrom:secretKeyRef:name: es-pwdkey: password- name: KIBANA_HOSTvalue: kibana.elastic.svc.cluster.local- name: KIBANA_PORTvalue: "5601"- name: NODE_NAMEvalueFrom:fieldRef:fieldPath: spec.nodeNamesecurityContext:runAsUser: 0resources:limits:cpu: 1000mmemory: 200Mirequests:cpu: 100mmemory: 100MivolumeMounts:- name: configmountPath: /etc/filebeat.ymlreadOnly: truesubPath: filebeat.yml- name: filebeat-indice-lifecyclemountPath: /etc/indice-lifecycle.jsonreadOnly: truesubPath: indice-lifecycle.json- name: datamountPath: /usr/share/filebeat/data- name: varlogmountPath: /var/logreadOnly: true- name: varlibdockercontainersmountPath: /var/lib/docker/containersreadOnly: true- name: dockersockmountPath: /var/run/docker.sockvolumes:- name: configconfigMap:defaultMode: 0600name: filebeat-config- name: filebeat-indice-lifecycleconfigMap:defaultMode: 0600name: filebeat-indice-lifecycle- name: varloghostPath:path: /var/log- name: varlibdockercontainershostPath:path: /var/lib/docker/containers- name: dockersockhostPath:path: /var/run/docker.sock- name: datahostPath:path: /var/lib/filebeat-datatype: DirectoryOrCreate
---apiVersion: rbac.authorization.k8s.io/v1kind: ClusterRoleBindingmetadata:name: filebeatnamespace: elasticsubjects:- kind: ServiceAccountname: filebeatnamespace: elasticroleRef:kind: ClusterRolename: filebeatapiGroup: rbac.authorization.k8s.io---apiVersion: rbac.authorization.k8s.io/v1kind: ClusterRolemetadata:name: filebeatlabels:app: filebeatrules:- apiGroups: [""]resources:- namespaces- podsverbs:- get- watch- list---apiVersion: v1kind: ServiceAccountmetadata:name: filebeatlabels:app: filebeat---

若有收获,就点个赞吧
0 人点赞
