2.1- ceph启用原生dashboard监控
1. 安装mgr插件
ceph-deploy install mgr
2. 启用
ceph-deploy mgr create mon1 mon2 mon3 mon4 mon5# 查看状态ceph mgr dump# 查看有哪些模块ceph mgr module lsyum install ceph-mgr-dashboard -y # mon节点ceph mgr module enable dashboard --force
3. 生成并安装签名证书
ceph dashboard create-self-signed-cert
4. 生成密钥
mkdir mgr-dashboardcd mgr-dashboardopenssl req -new -nodes -x509 -subj "/O=IT/CN=ceph-mgr-dashboard" -days 3650 -keyout dashboard.key -out dashboard.crt -extensions v3_ca
nautilus版需要在所有mgr节点安装 ceph-mgr-dashboard,然后开启dashboard。
5. 配置地址,端口并启动服务
ceph config set mgr mgr/dashboard/server_addr 10.68.3.141ceph config set mgr mgr/dashboard/server_port 8194ceph mgr services[root@mon1 mgr-dashboard]# ceph mgr services{"dashboard": "https://ceph-deploy:8443/"}
6. 创建一个用户、密码
ceph dashboard set-login-credentials admin admin
7. 验证
浏览器登录: https://10.68.3.121:8443


2.2- 使用prometheus监控
promtheus服务器: 10.68.3.101:5061
grafana服务器:10.68.3.101:6129
1. 在ceph mgr admin节点上启动插件
ceph mgr module enable prometheus
2. 查看插件是否启动
[root@mon1 ~]# netstat -tunlp|grep mgrtcp 0 0 10.68.3.141:6800 0.0.0.0:* LISTEN 14686/ceph-mgrtcp 0 0 10.68.3.141:6801 0.0.0.0:* LISTEN 14686/ceph-mgrtcp6 0 0 :::9283 :::* LISTEN 14686/ceph-mgr
3. 检查是否已经获取到数据
curl 10.68.3.141:9283/metrics
4. 配置prometheus server 添加ceph集群 job
vim /etc/prometheus.yml- job_name: 'ceph'honor_labels: truescrape_interval: 5sstatic_configs:- targets: ['10.68.3.141:9283']labels:instance: ceph## 重启promtheussystemctl restart prometheus
5. 浏览器检查
http://10.68.3.101:5601/targets
6. grafana配置
①浏览器登录 grafana 管理界面
②添加data sources ,点击configuration—》data sources
7. 添加dashboard
选择合适的版本:granafa版本是grafana-7.1.0。
https://grafana.com/grafana/dashboards?search=ceph

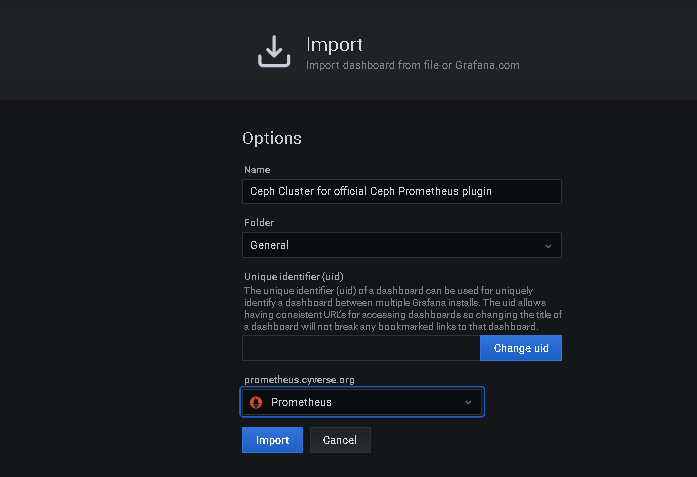
8. 在线导入dashboard

9. 如果是离线导入需要先下载json文件
https://grafana.com/grafana/dashboards/2842
10. 导入jsoin文件


11. 检查结果

12. 导入更多到监控模板
https://grafana.com/grafana/dashboards/12701
13. 查看结果

2.3- 使用ceph_exporter监控
github地址:https://github.com/digitalocean/ceph_exporter
1. 安装ceph_exporter
wget http://static.zybuluo.com/zphj1987/jiwx305b8q1hwc5uulo0z7ft/ceph_exporter-2.0.0-1.x86_64.rpmrpm -ivh ceph_exporter-2.0.0-1.x86_64.rpm
2. 修改ceph_exporter文件
[root@mon2 ~]# ceph_exporter -h
Usage of ceph_exporter:
  -ceph.config string
        path to ceph config file
  -ceph.user string
        Ceph user to connect to cluster. (default "admin")
  -exporter.config string
        Path to ceph exporter config. (default "/etc/ceph/exporter.yml")
  -telemetry.addr string
        host:port for ceph exporter (default ":9128")
  -telemetry.path string
        URL path for surfacing collected metrics (default "/metrics")
事例:可以定义多个集群 详细参数:https://github.com/digitalocean/ceph_exporter
3. 修改启动端口
[root@mon2 ~]# cat /usr/lib/systemd/system/ceph_exporter.service
[Unit]
Description=ceph_exporter for promethous
After=network.target

[Service]
ExecStart=/usr/bin/ceph_exporter -telemetry.addr :9999
ExecReload=/bin/kill -HUP $MAINPID
KillMode=process
Restart=on-failure
4. 启动服务
systemctl daemon-reload
systemctl  restart ceph_exporter
5. 检查服务
[root@mon2 ~]# netstat -tunlp|grep 9999
tcp6       0      0 :::9999                 :::*                    LISTEN      19306/ceph_exporter

curl 10.68.3.142:9999/metrics # 输出很多信息
- 修改promtheus
cat /etc/prometheus.yml ## 添加以下内容
- job_name: 'ceph_exporter'
  static_configs:
  - targets: ['10.68.3.142:9999']
    labels:
      instance: ceph_exporter
## 重启prometheus
6. 浏览器检查
http://10.68.3.101:5061/targets
7. 查看指标

8. 配置grafana导入模板
查找dashoboard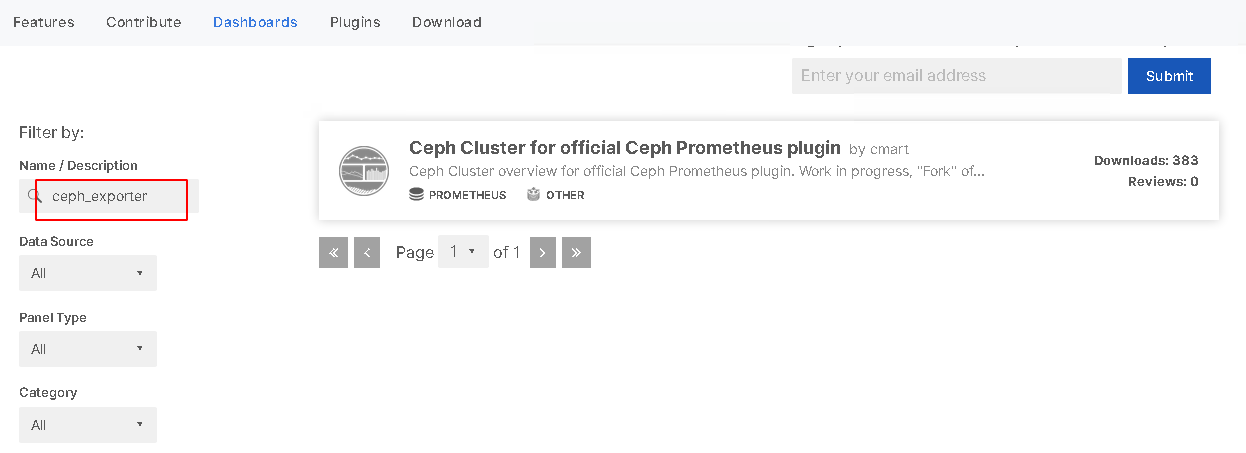
https://grafana.com/grafana/dashboards?search=ceph_exporter

9. 检查结果

2.4- 使用LOKI监控ceph集群日志
1. loki服务器安装
curl -O -L "https://github.com/grafana/loki/releases/download/v2.1.0/loki-linux-amd64.zip"
unzip loki-linux-amd64.zip
mv loki-linux-amd64 /usr/sbin/loki

## 查看版本
[root@harbor system]# loki -version
2020-12-31 13:38:18.477182 I | proto: duplicate proto type registered: ingester.Series
loki, version 2.1.0 (branch: HEAD, revision: 1b79df37)
  build user:       root@b8941a81fe55
  build date:       2020-12-24T14:08:17Z
  go version:       go1.15.3
  platform:         linux/amd64
2. 支持参数
loki -h
3. 设置systemd启动
## 创建配置文件
cat << eof > /etc/loki-local-config.yaml
auth_enabled: false

server:
  http_listen_port: 8194

ingester:
  lifecycler:
    address: 127.0.0.1
    ring:
      kvstore:
        store: inmemory
      replication_factor: 1
    final_sleep: 0s
  chunk_idle_period: 5m
  chunk_retain_period: 30s

schema_config:
  configs:
    - from: 2020-07-09
      store: boltdb
      object_store: filesystem
      schema: v9
      index:
        prefix: index_
        period: 168h

storage_config:
  boltdb:
    directory: /tmp/loki/index

  filesystem:
    directory: /tmp/loki/chunks

limits_config:
  enforce_metric_name: false
  reject_old_samples: true
  reject_old_samples_max_age: 168h
eof

## 创建systemd服务文件
cat <<eof > /usr/lib/systemd/system/loki.service
[Unit]
Description=Loki Monitoring System
Documentation=Loki Monitoring System

[Service]
ExecStart=/usr/sbin/loki   -config.file=/etc/loki-local-config.yaml \
-log.level info   -distributor.ring.instance-interface-names enp5s0  \
-ingester.lifecycler.interface enp5s0  \
-ruler.ring.instance-interface-names enp5s0
[Install]
WantedBy=multi-user.target
eof
4. 启动服务
mkdir -p /tmp/loki
systemctl daemon-reload
systemctl restart loki
systemctl enable loki
5. 每个节点安装promtail服务
curl -O -L "https://github.com/grafana/loki/releases/download/v2.1.0/promtail-linux-amd64.zip"
unzip promtail-linux-amd64.zip
mv promtail-linux-amd64 /usr/sbin/promtail
6. 查看支持参数
[root@mon1 ~]# promtail -version
promtail, version 2.1.0 (branch: HEAD, revision: 1b79df37)
  build user:       root@b8941a81fe55
  build date:       2020-12-24T14:08:17Z
  go version:       go1.15.3
  platform:         linux/amd64

promtail -h
7. 创建promail 配置文件 promtail.yml
详细配置说明: https://grafana.com/docs/loki/latest/clients/promtail/configuration/
cat <<eof > /etc/promtail.yml
# Promtail Server Config
server:
  http_listen_port: 6129
  grpc_listen_port: 8080

# 指明promtail的配置文件在什么地方生成
positions:
  filename: /tmp/positions.yaml

# Loki服务器的地址
clients:
  - url: http://10.68.3.101:8194/loki/api/v1/push

scrape_configs:
  - job_name: mon1
    static_configs:
      - targets:
          - 10.68.3.141
        labels:
          job: ceph-mon1
          host: 10.68.3.141
          __path__: /var/log/ceph/*.log   ## 定义ceph的日志路径文件,只能匹配文件,不能匹配目录
eof
8. systemd 纳管promtail服务
[Unit]
Description=promtail Log  Monitoring Agent
Documentation=Prometheus Log Monitoring Agent

[Service]
ExecStart=/usr/sbin/promtail   --config.file /etc/promtail.yml   --log.level=info

[Install]
WantedBy=multi-user.target
9. 启动服务
systemctl daemon-reload
systemctl restart promtail
systemctl enable promtail
10. 验证服务
[root@mon1 ~]# netstat -tunlp|grep prom
tcp6       0      0 :::8080                 :::*                    LISTEN      29802/promtail
tcp6       0      0 :::6129                 :::*                    LISTEN      29802/promtail
11. 查看position.yaml
[root@mon1 ~]# cat /tmp/positions.yaml
positions:
  /var/log/ceph/ceph-client.rgw.mon1.log: "91"
  /var/log/ceph/ceph-mds.mon1.log: "91"
  /var/log/ceph/ceph-mgr.mon1.log: "5373105"
  /var/log/ceph/ceph-mon.mon1.log: "7666155"
  /var/log/ceph/ceph-osd.0.log: "397099"
  /var/log/ceph/ceph-osd.3.log: "398467"
  /var/log/ceph/ceph-osd.6.log: "397209"
  /var/log/ceph/ceph-volume.log: "0"
  /var/log/ceph/ceph.audit.log: "8957736"
  /var/log/ceph/ceph.log: "5253549"
12. 浏览器验证
http://10.68.3.141:6129/targets
同理添加其他节点
13. grafana配置数据
注意:grafana到版本要7以及以上

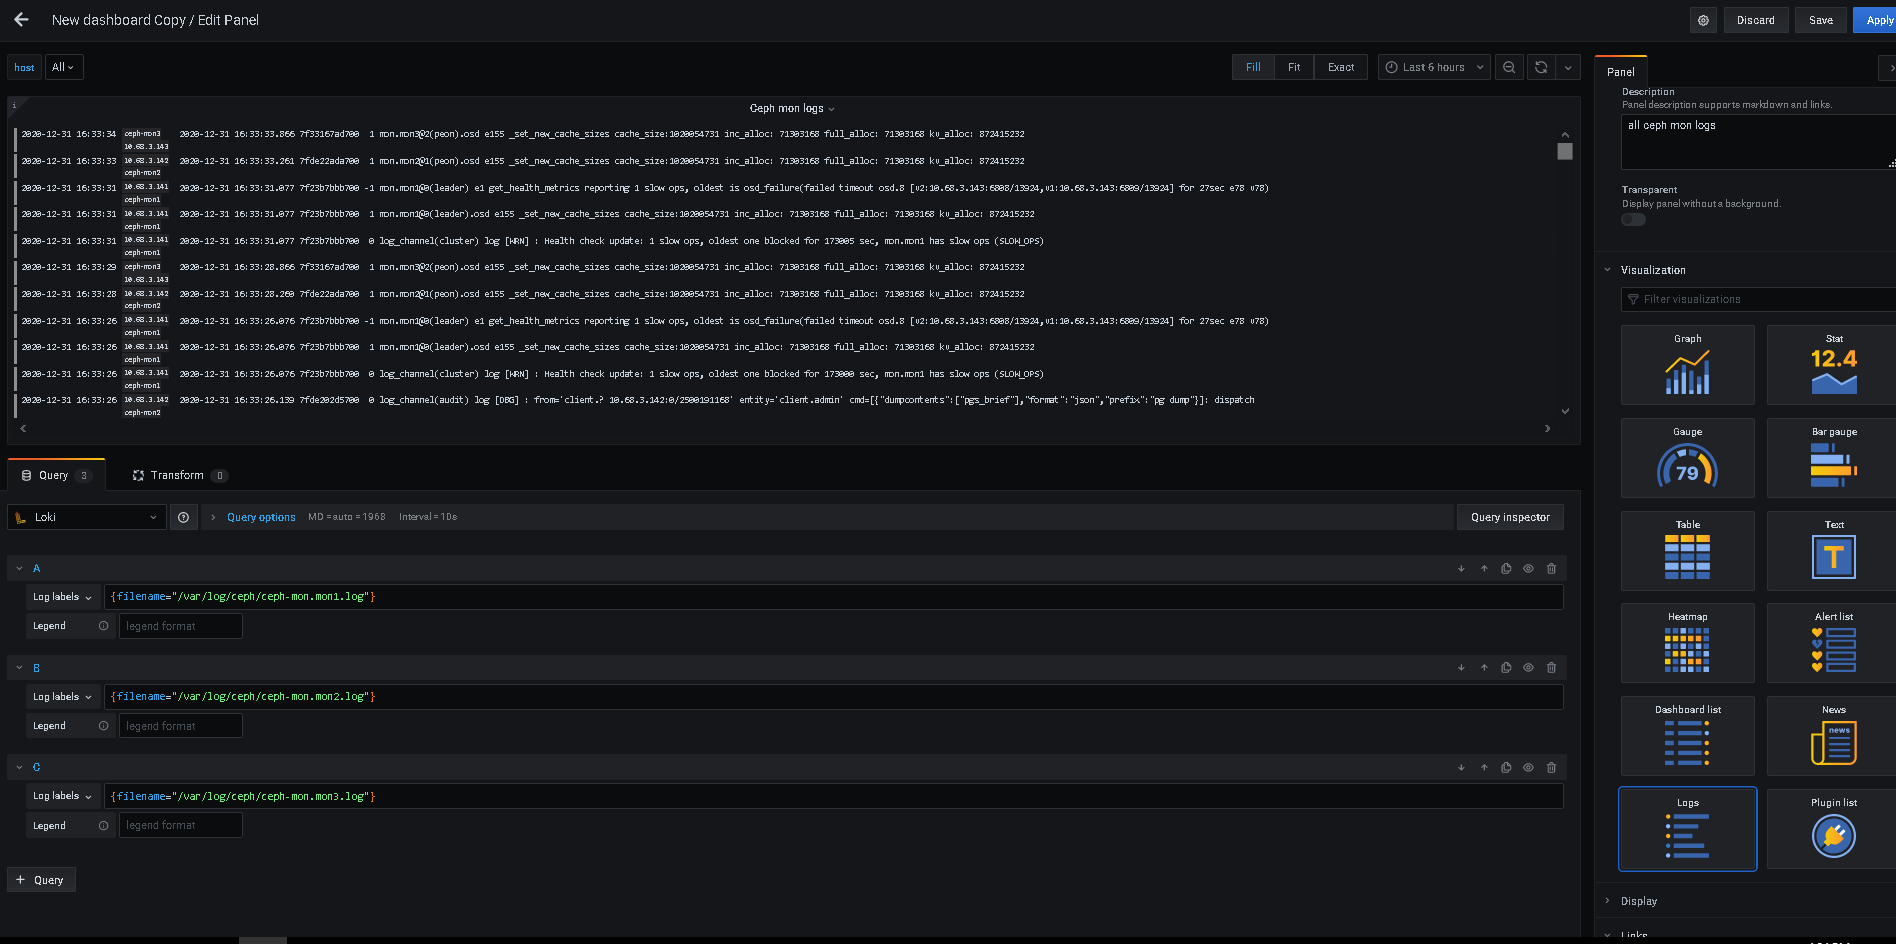
14. explore模式检查

15. 添加dashboard
- grafana变量

若有收获,就点个赞吧
0 人点赞
