概念理解:
熵(entropy)指的是体系的混乱的程度;
我这里图像熵应该是属于一种信息熵;
信息熵:信息熵简单来说就是把信息进行了量化。通过熵的大小表示信息的混乱程度。一般情况下,图像中包涵的信息量多,熵值越大。
代码实现:
计算一维向量的信息熵:
def entropy(signal):'''function returns entropy of a signalsignal must be a 1-D numpy array'''lensig = signal.sizesymset = list(set(signal))numsym = len(symset)propab = [np.size(signal[signal == i]) / (1.0 * lensig) for i in symset]ent = np.sum([p * np.log2(1.0 / p) for p in propab])return ent
读取图片并转变为灰度图( 建议图片不要太大,不然会运行很久,调整为256左右大小比较好):
colorIm=Image.open('mo.JPG')greyIm=colorIm.convert('L')colorIm=np.array(colorIm)greyIm=np.array(greyIm)
参数N表示计算熵的区域的大小。
对于N=5,区域包含10*10=100像素值。
在下面的循环中,对每个像素位置提取对应的邻域。
二维的邻域被扁平化为一维的numpy数组并传递给熵函数。
熵值被插入到熵阵E中。
N = 5S = greyIm.shapeE = np.array(greyIm)for row in range(S[0]):for col in range(S[1]):Lx = np.max([0, col - N])Ux = np.min([S[1], col + N])Ly = np.max([0, row - N])Uy = np.min([S[0], row + N])region = greyIm[Ly:Uy, Lx:Ux].flatten()E[row, col] = entropy(region)
效果展示:
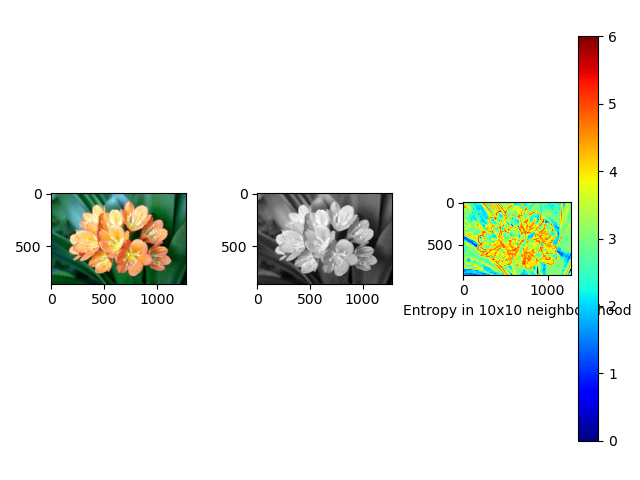
最后利用matplotlib的pyplot函数绘制出原始的RGB图像、对应的灰度图像和熵图像
plt.subplot(1, 3, 1)plt.imshow(colorIm)plt.subplot(1, 3, 2)plt.imshow(greyIm, cmap=plt.cm.gray)plt.subplot(1, 3, 3)plt.imshow(E, cmap=plt.cm.jet)plt.xlabel('Entropy in 10x10 neighbourhood')plt.colorbar()plt.show()
计算图像整体的信息熵
def get_entropy(img):#输入img 灰度矩阵#输出图像整体的信息熵tmp = []val = 0k = 0res = 0for i in range(256):tmp.append(0)for i in range(len(img)):for j in range(len(img[i])):val = img[i][j]tmp[val] = float(tmp[val] + 1)k = float(k + 1)for i in range(len(tmp)):tmp[i] = float(tmp[i] / k)for i in range(len(tmp)):if(tmp[i] == 0):res = reselse:res = float(res - tmp[i] * (math.log(tmp[i]) / math.log(2.0)))return res

若有收获,就点个赞吧
0 人点赞
