translator: http://www.jobbole.com/members/snowhere/ reviewer: http://www.jobbole.com/members/hanxiaomax/
via: https://www.javacodegeeks.com/2018/09/debugging-java-streams-with-intellij.html
使用 IntelliJ 调试 Java Streams
Debugging Java Streams with IntelliJ
Streams are very powerful and can capture the gist of your intended functionality in just a few lines. But, just as smooth as they are when it all works, just as agonizing it can be when they don’t behave as expected. Learn how to use IntelliJ to debug your Java Streams and gain insight into the intermediate operations of a Stream.
Streams 非常强大,并且能够用简单几行代码实现你所期望的功能要点。它们正常运行时非常流畅优雅,但运行不符合预期时却让人苦不堪言。让我们学习一下如何用 IntelliJ 调试你的 Java Streams 代码,并洞察 Stream 的中间操作。
In this article, I will use the Sakila sample database and Speedment Stream ORM in my examples.
在这篇文章中,我将在例子里用到 Sakila 样本数据库和 Speedment Stream ORM 框架。
The Principle
原理
Let’s start with a simple Stream that we can use to establish the fundamentals of the Stream debugger in IntelliJ:
让我们从一个简单的 Stream 开始,我们可以在 IntelliJ 为其创建一个基本的 Stream debugger:
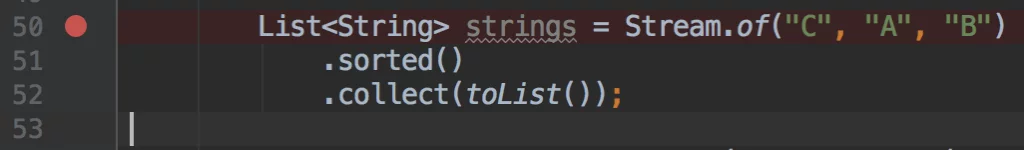
List<String> strings = Stream.of("C", "A", "B").sorted().collect(toList());
The code above first creates an initial Stream consisting of the String elements “C”, “A”, “B”. Then, an intermediary operation sorted() is applied to the first Stream, thereby (at least in Java 8-10) creating a new Stream where the elements in the initial stream are sorted according to their natural order. I.e. the second stream will contain the elements “A”, “B”, “C”. Lastly, these elements are collected into a List.
上面的代码创建了一个由字符串 “A”、“B”、“C”组成的 Stream。紧接着对这个 Stream 进行 sorted() 操作,从而创建了一个新的 Stream(至少在 Java 8-10 中是这样),其中的元素是第一个 Stream 的元素按字母排序的结果。也就是说,第二个 Stream 包含“A”、“B”、“C”三个元素。最后,这些将元素放到一个 List 中。
The code above is equivalent to:
上面的代码和下面的等价:
Stream<String> s0 = Stream.of("C", "B", "A"); // "C", "A", "B"Stream<String> s1 = s0.sorted(); // "A", "B", "C"List<String> strings = s1.collect(toList()); // [“A”, “B”, “C”]
This is basically how the Stream debugger operates. It breaks up a stream pipeline into smaller segments and progressively invokes the different intermediate operators while retaining the elements for each step analyzed:
这大体上演示了 Stream debugger 如何工作。它将一个 stream 管道操作分割成多个代码片段,一步一步地调用中间运算操作,从而可以保留每一步操作的元素内容以供分析。
Stream.of("C", "B", "A").peek(saveStep(0)).sorted().peek(saveStep(1)).collect(toList()); // The final result is saved to step 2
NB: This is not exactly how it works technically, but it provides a good overall outline.
注意:真正的技术实现并不是上面这样,它只是提供了很好的概览。
Visually, it looks like this in IntelliJ’s debugger:
在 IntelliJ’s debugger 中有更加形象化的表示:
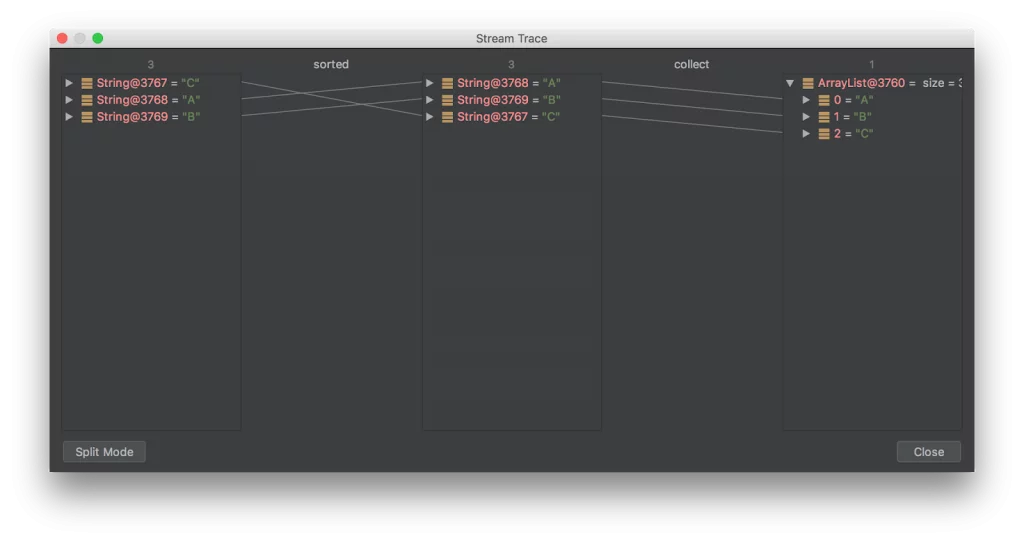
This gives a clear and concise view of what is going on internally in the Stream pipeline between each intermediate operation and also shows the final result of the Stream.
它简洁明了地展示了 Stream 管道里的每个中间操作细节,以及最后结果。
Invocation
调用
The stream debugger is invoked by first setting a breakpoint where a Stream is defined:
想调用 stream debugger 的话,首先要在 Stream 定义处设置断点:
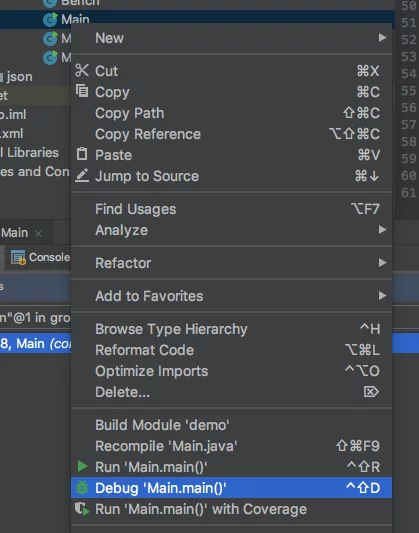
Then, start a debug session:
然后,启动调试会话(以 debug 模式运行):
When the breakpoint is hit, the Stream debugger can be invoked by pressing its designated (and arguably somewhat concealed) button as indicated by the red circle below:
当到达断点时,可以按指定的按钮(可能有些不好找)来调用 Stream debugger,下面用红圈标出:
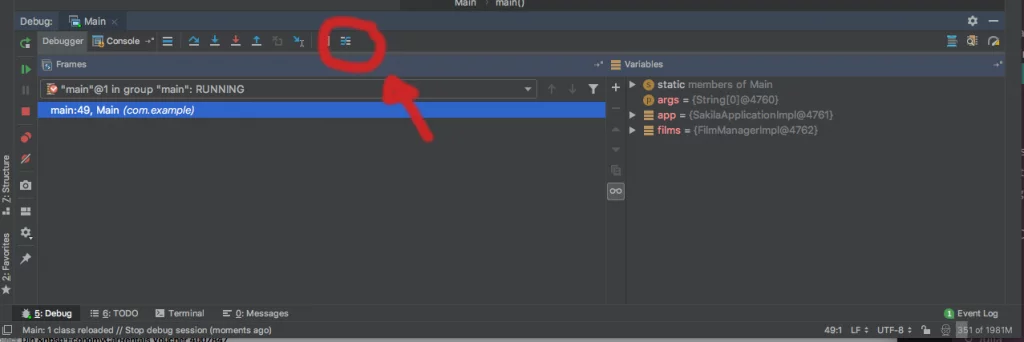
This will pull up the stream debugger as shown previously in the article.
这样就打开了 stream debugger,和上文所展示的一样。
Database Streams
数据库 Streams
I will use the stream ORM Speedment that allows databases to be queried using standard Java Streams and thus, these streams can also be debugged with IntelliJ. A Speedment project can be set up using the Speedment initializer.
我将使用 Speedment(stream ORM),它允许通过标准的 Java Streams 操作来查询数据库,因此也能通过 IntelliJ 来调试操作。可以通过 Speedment initializer 来创建一个 Speedment 项目。
The Java application itself can be set up like this:
可以通过下面方式创建一个 Java 应用。
Speedment app = new SakilaApplicationBuilder().withPassword("sakila-password") // Replace with your own password.build();FilmManager films = app.getOrThrow(FilmManager.class);
Now, we can stream the database table “film”. For example like this:
现在我们可以对数据库“film”表进行 stream 操作。下面是个例子:
List<Film> map = films.stream().filter(Film.LENGTH.equal(60)).sorted(Film.RATING.reversed()).collect(toList());
This will filter out all Film objects with a length equal to 60 minutes, then sort those Film objects according to the Film.RATING (descending) and then collect these elements into a List.
代码将从所有 Film(电影) 对象中筛选出长度为 60 分钟的,然后通过 Film.RATING(评级)对这些 Film 对象进行排序(降序),最后将所有元素放入一个 List。
When we invoke the Stream debugger, we will see the following:
我们调用 Stream debugger 时,会看到下面这张图:
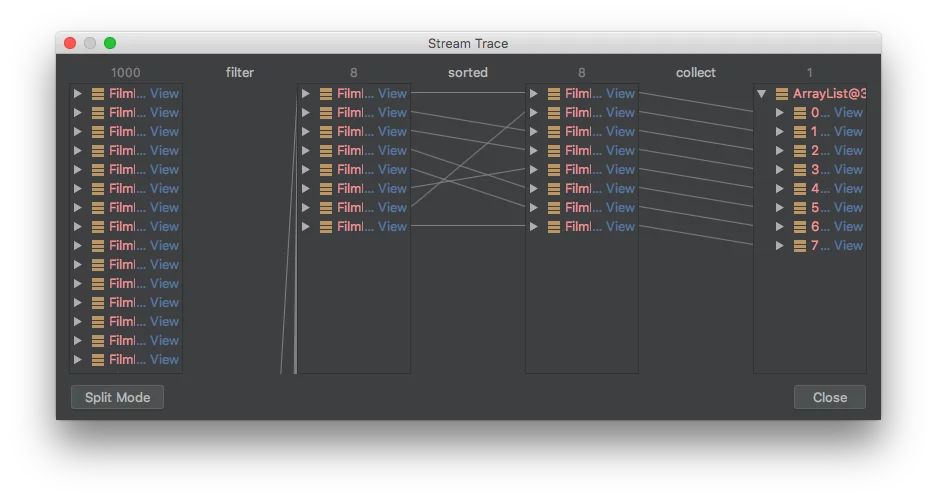
As can be seen, there are 1,000 films in the initial stream. After the filter operator, just 8 films remain which are subsequently sorted and then collected to a List.
我们可以看到,初始 stream 中有 1000 部电影。筛选操作后,只剩 8 部电影,紧接着排序并放到一个 List。
Compute Statistics
计算统计
Suppose we want to compute the min, max and average length of all films rated PG-13. This can be done like this:
假设我们要计算所有 PG-13 级别(电影分级制度中的一种)电影的最小时长、最大时长以及平均时长。代码如下:
IntSummaryStatistics stat = films.stream().filter(Film.RATING.equal("PG-13")).mapToInt(Film.LENGTH.asInt()).summaryStatistics();
And looks like this in the Stream debugger:
Stream debugger 展示如下:
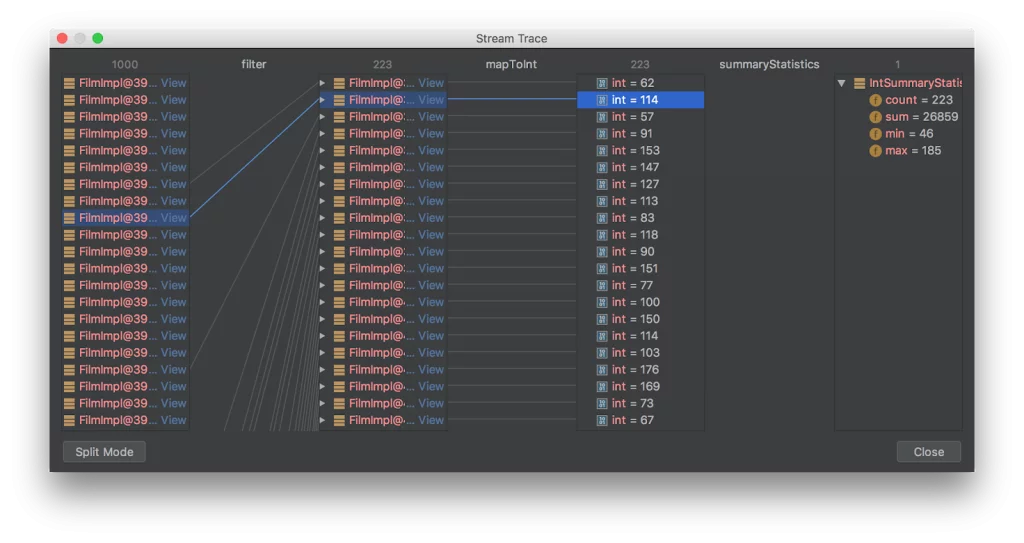
As can be seen, it is possible to interact with the Stream debugger and click on elements whereby their path in the stream pipeline is highlighted. It is also possible to scroll among the elements for individual steps.
可以看出,我们可以与 Stream debugger 交互,并在 stream 管道中点击元素来高亮显示,也可以在元素间滚动查看单个操作步骤。
Speedment normally optimizes away intermediary operations in a database Stream and merges these steps into the SQL query. However, when the Stream debugger is used, no such optimization takes place and we are able to see all steps in the stream pipeline.
Speedment 优化了数据库 Stream 中间操作,并将其融合进 SQL 查询。但使用 Stream debugger 时,优化并没有生效,以便让我们可以看到 Stream 管道中的所有操作步骤。
Conclusions
结论
The Stream debugger is a hidden gem that can be of significant help when working with Streams.
Stream debugger 是个隐藏的瑰宝,对于 Streams 工作有很大帮助。
I think the IntelliJ team has come up with a really good feature.
我认为这是 IntelliJ 团队提供的非常棒的特性。

若有收获,就点个赞吧
0 人点赞
