监控Nginx主要用到以下两个模块:
- nginx-module-vts
- nginx-vts-exporter
nginx-module-vts 模块编译
Nginx virtual host traffic status module,Nginx的监控模块,能够提供JSON格式的数据产出。
# 查看nginx 安装了哪些模块/usr/local/nginx/sbin/nginx -V# 下载 vts 模块cd /usr/local/srcgit clone git://github.com/vozlt/nginx-module-vts.git# 编译安装 nginx-module-vts 模块cd /usr/local/src/nginx-1.12.1/./configure --user=nginx --group=nginx --prefix=/usr/local/nginx --pid-path=/usr/local/nginx/pid/nginx.pid --without-http_memcached_module --with-http_stub_status_module --with-http_ssl_module --with-http_gzip_static_module --add-module=/usr/local/src/nginx-module-vts/make# 替换 nginx 启动文件mv /usr/local/nginx/sbin/nginx{,.old} && cp /usr/local/src/nginx-1.12.1/objs/nginx /usr/local/nginx/sbin/# 重启 nginxsystemctl restart nginx
修改nginx 的配置文件 nginx.conf
http {vhost_traffic_status_zone;# 开启此功能,在Nginx配置有多个server_name的情况下,会根据不同的server_name进行流量的统计,# 否则默认会把流量全部计算到第一个server_name上。vhost_traffic_status_filter_by_host on;...server {# 在不想统计流量的server区域禁用vhost_traffic_statusvhost_traffic_status off;# 假如nginx没有规范配置server_name或者无需进行监控的server上,那么建议在此vhost上禁用统计监控功能。# 否则会出现“127.0.0.1”,hostname等的域名监控信息...location /status {vhost_traffic_status_display;vhost_traffic_status_display_format html;}}}
浏览器访问: http://{nginx_IP}/status 出现数据页面
nginx-vts-exporter
docker pull sophos/nginx-vts-exporter:latestdocker run -ti -d \--restart always \--name nginx-vts \-p 9913:9913 \--env NGINX_STATUS="http://localhost/status/format/json" \sophos/nginx-vts-exporter# NGINX_STATUS 要改成自己对应的主机。 一般情况下, nginx-vts-exporter 与 nginx 在同一个主机上。
浏览器访问: http://{nginx_vts_IP}:9913/metrics 出现数据页面
将nginx-vts 加入 prometheus中
vim /usr/local/prometheus/prometheus.yml- job_name: nginxstatic_configs:- targets: ['192.168.2.210:9913']labels:instance: nginx-web-1# 重启 prometheus
grafana 模板
导入如下监控模版: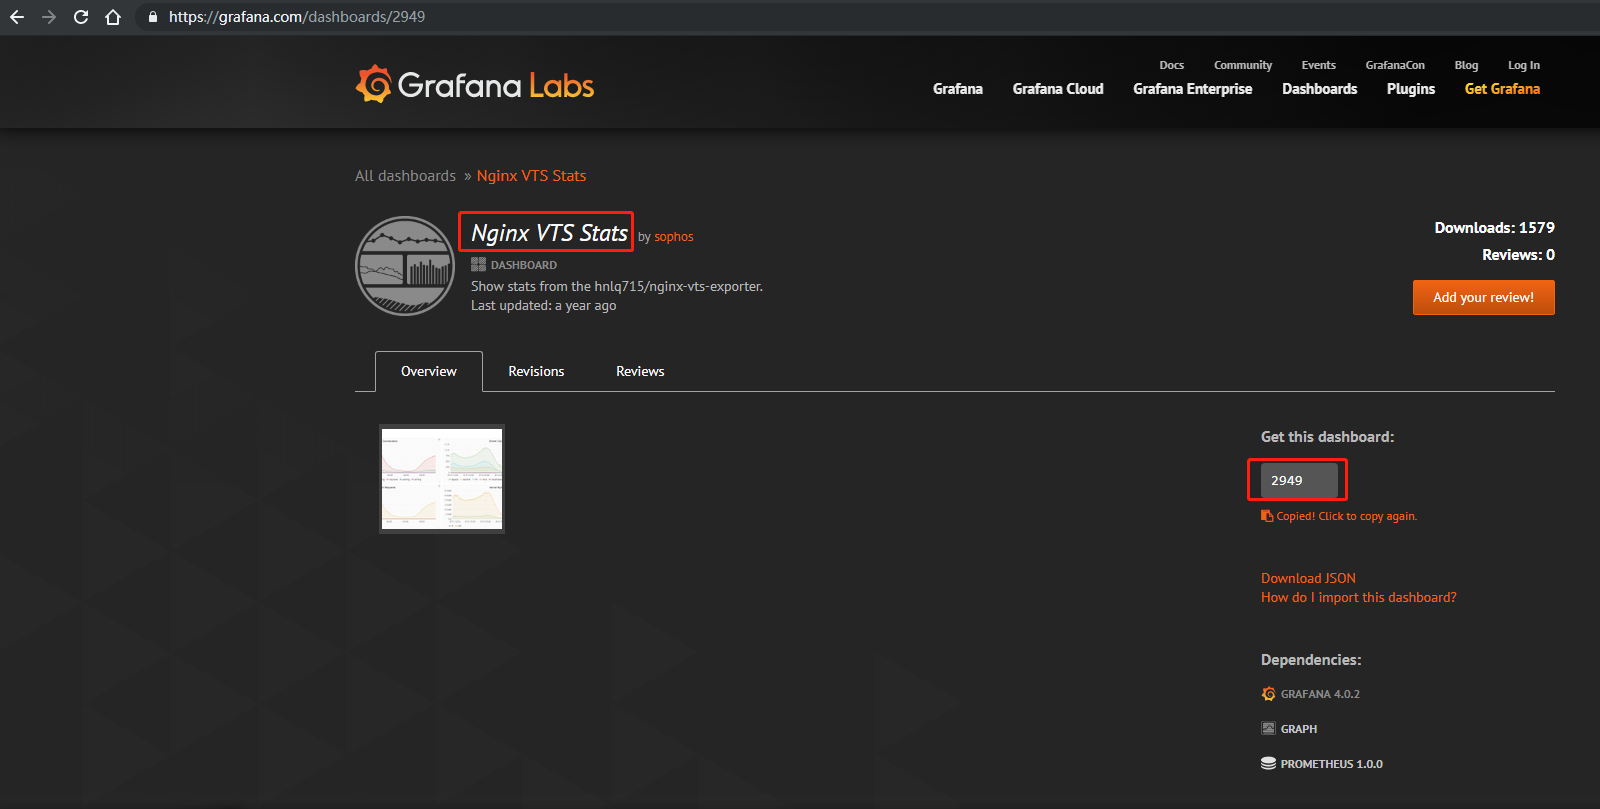
监控图表如下: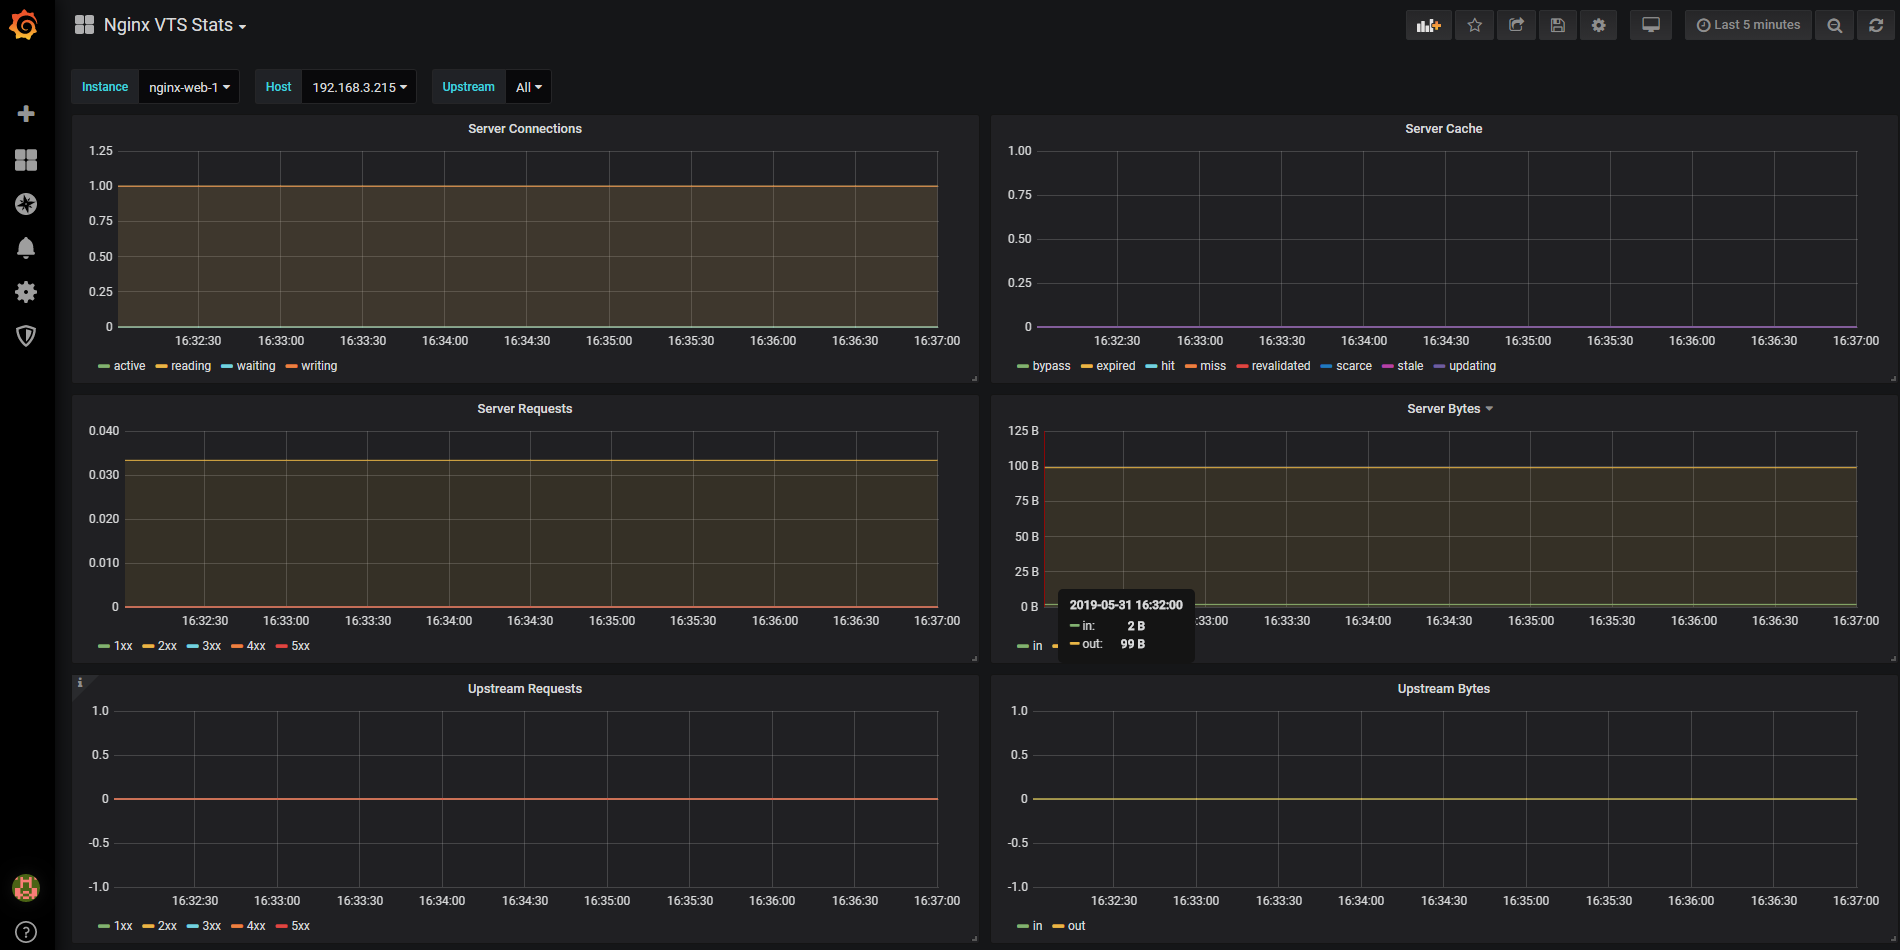
Nginx监控在Prometheus的数据汇总
常用监控汇总表达式:DomainName对应nginx conf里的server_name,这里可以根据不同的server_name和upstream分别进行qps、2xx/3xx/4xx/5xx的状态码监控,另外也可以监控nginx每台后端server的qps和后端接口响应时间。如果不需要区分server_name,可以把表达式里的$DomainName改为星号,“*****”代表所有;# 1. 求Nginx的QPS:sum(irate(nginx_server_requests{code="total",host=~"$DomainName"}[5m]))sum(irate(nginx_server_requests{instance=~"$Instance", code!="total"}[5m])) by (code)# 2. 求4xx万分率(5xx类似,code=“5xx”):(sum(irate(nginx_server_requests{code="4xx",host=~"$DomainName"}[5m])) / sum(irate(nginx_server_requests{code="total",host=~"$DomainName"}[5m]))) * 10000# 3. 求upstream的QPS(示例求group1的qps):sum(irate(nginx_upstream_requests{code="total",upstream="group1"}[5m]))# 4. 求upstream后端server的响应时间(示例求group1的后端响应时间):nginx_upstream_responseMsec{upstream=“group1”}nginx_upstream_responseMsec{backend="192.168.x.xxx:8803",instance="nginx-web-1",job="nginx",upstream="UPSTREAM_NAME"}

若有收获,就点个赞吧
0 人点赞
