简介:
- node_exporter: 负责收集客户端各项指标数据,如CPU、内存、硬盘等实时状态数据;
- prometheus:获取node_exporter的数据并处理,对原始数据加工配置各种告警规则;
- grafana:从prometheus获取数据并根据自定义的仪表盘展示监控数据;
部署:
- node_exporter
```shell
下载安装包
wget https://github.com/prometheus/node_exporter/releases/download/v1.1.2/node_exporter-1.1.2.linux-amd64.tar.gz
解压并移动文件
tar zxvf node_exporter-1.1.2.linux-amd64.tar.gz mv node_exporter-1.1.2.linux-amd64 /usr/local/bin/node_exporter
加入systemd服务
cat > /etc/systemd/system/node_exporter.service << EOF [Unit] Description=node_exporter Documentation=https://prometheus.io/ After=network.target
[Service] Type=simple ExecStart=/usr/local/bin/node_exporter Restart=on-failure
[Install] WantedBy=multi-user.target EOF
启动服务
systemctl enable —now node_exporter
查看状态
systemctl status node_exporter
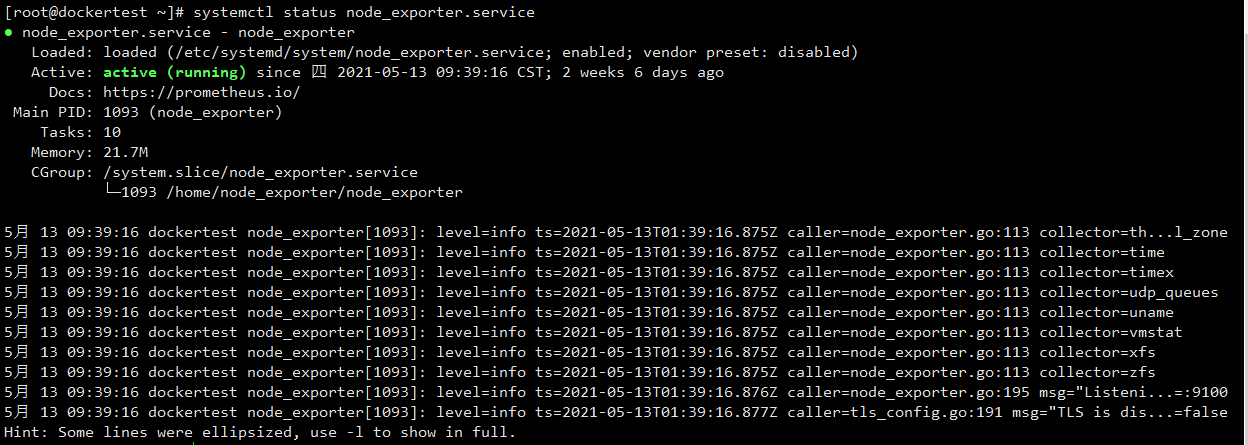访问9100端口<br />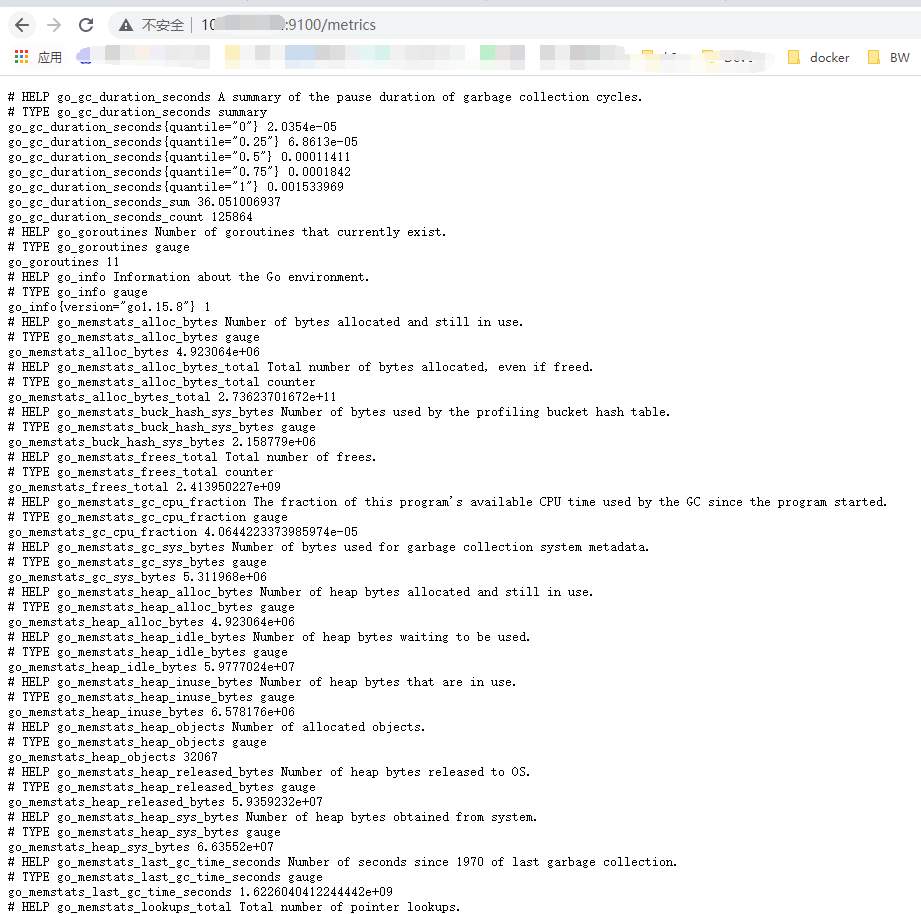2. prometheus```shell#下载包wget https://github.com/prometheus/prometheus/releases/download/v2.27.1/prometheus-2.27.1.linux-amd64.tar.gz#解压tar -xvf prometheus-*.tar.gzcd prometheus-*#加入systemdcat > /etc/systemd/system/prometheus.service << EOF[Unit]Description=PrometheusDocumentation=https://prometheus.io/After=network.target[Service]Type=simpleExecStart=/home/prometheus/prometheus --config.file=/home/prometheus/prometheus.yml --storage.tsdb.path=/home/prometheus/data --storage.tsdb.retention=60dRestart=on-failure[Install]WantedBy=multi-user.targetEOF#设置开机启动systemctl enable --now prometheus
配置文件参考:
cat prometheus.yml
# 全局配置global:scrape_interval: 15s # Set the scrape interval to every 15 seconds. Default is every 1 minute.evaluation_interval: 15s # Evaluate rules every 15 seconds. The default is every 1 minute.# 告警端口alerting:alertmanagers:- static_configs:- targets:- 10.10.16.218:9093# 告警规则文件rule_files:- "rules.yml"# 数据源配置scrape_configs:# The job name is added as a label `job=<job_name>` to any timeseries scraped from this config.- job_name: '普罗米修斯'static_configs:- targets: ['localhost:9090']- job_name: '猫的测试主机'static_configs:- targets: ['localhost:9100']
cat rules.yml
groups:- name: 通用预警模板rules:- alert: "实例丢失"expr: up == 0for: 1mlabels:severity: pageannotations:summary: "服务器实例 {{ $labels.instance }} 丢失"description: "{{ $labels.instance }} 上的任务 {{ $labels.job }} 已经停止了 1 分钟以上了"- alert: "磁盘容量小于 10%"expr: (node_filesystem_size_bytes - node_filesystem_avail_bytes) / node_filesystem_size_bytes * 100 > 90for: 30sannotations:summary: "服务器实例 {{ $labels.instance }} 磁盘不足 告警通知"description: "{{ $labels.instance }}磁盘 {{ $labels.device }} 资源 已不足 10%, 当前值: {{ $value }}"- alert: "内存容量小于 20%"expr: ((node_memory_MemTotal_bytes - node_memory_MemFree_bytes - node_memory_Buffers_bytes - node_memory_Cached_bytes) / (node_memory_MemTotal_bytes )) * 100 > 80for: 30slabels:severity: warningannotations:summary: "服务器实例 {{ $labels.instance }} 内存不足 告警通知"description: "{{ $labels.instance }}内存资源已不足 20%,当前值: {{ $value }}"- alert: "CPU 平均负载大于 4 "expr: node_load5 > 4for: 30sannotations:sumary: "服务器实例 {{ $labels.instance }} CPU 负载 告警通知"description: "{{ $labels.instance }}CPU 平均负载(5 分钟) 已超过 4 ,当前值: {{ $value }}"- alert: "磁盘读 I/O 超过 30MB/s"expr: irate(node_disk_read_bytes_total{device="sda"}[1m]) > 30000000for: 30sannotations:sumary: "服务器实例 {{ $labels.instance }} I/O 读负载 告警通知"description: "{{ $labels.instance }}I/O 每分钟读已超过 3MB/s,当前值: {{ $value }}"- alert: "磁盘写 I/O 超过 30MB/s"expr: irate(node_disk_written_bytes_total{device="sda"}[1m]) > 30000000for: 30sannotations:sumary: "服务器实例 {{ $labels.instance }} I/O 写负载 告警通知"description: "{{ $labels.instance }}I/O 每分钟写已超过 30MB/s,当前值: {{ $value }}"- alert: "网卡流出速率大于 10MB/s"expr: (irate(node_network_transmit_bytes_total{device!~"lo"}[1m]) / 1000) > 10000000for: 30sannotations:sumary: "服务器实例 {{ $labels.instance }} 网卡流量负载 告警通知"description: "{{ $labels.instance }}网卡 {{ $labels.device }} 流量已经超过 10MB/s, 当前值: {{ $value }}"- alert: "CPU 使用率大于 90%"expr: 100 - ((avg by (instance,job,env)(irate(node_cpu_seconds_total{mode="idle"}[30s]))) *100) > 90for: 30sannotations:sumary: "服务器实例 {{ $labels.instance }} CPU 使用率 告警通知"description: "{{ $labels.instance }}CPU 使用率已超过 90%, 当前值: {{ $value }}"
prometheus告警钉钉插件配置文件参考:
cat alertmanager/alertmanager.yml
global:resolve_timeout: 5m #5分钟后未收到告警将信息标记为已解决route:group_by: [alertname] #采用哪个标签作为分组group_wait: 10s #等待10秒 一起发送报警group_interval: 10s #组报警间隔时间repeat_interval: 2m #重复报警间隔时间receiver: ops_notify #设置默认接收人#routes:#- receiver: ops_notify# match_re:# alertname: 实例存活告警|磁盘使用率告警 # 匹配告警规则中的名称发送receivers:- name: ops_notifywebhook_configs:- url: http://localhost:8060/dingtalk/webhook_legacy/send #这里的webhook_legacy 为告警通知的路由send_resolved: true #报警解除通知inhibit_rules:- source_match:severity: 'critical'target_match:severity: 'firing'equal: ['alertname', 'dev', 'instance']#templates:# - '/home/prometheus/alertmanager/template/default.tmpl'
cat prometheus-webhook-dingtalk-1.4.0.linux-amd64/config.yml
## Request timeout# timeout: 5s## 通知模板路径templates:- /home/prometheus/prometheus-webhook-dingtalk-1.4.0.linux-amd64/contrib/templates/legacy/template2.tmpl## You can also override default template using `default_message`## The following example to use the 'legacy' template from v0.3.0# default_message:# title: '{{ template "legacy.title" . }}'# text: '{{ template "legacy.content" . }}'## Targets, previously was known as "profiles"targets:webhook1:url: https://oapi.dingtalk.com/robot/send?access_token=xxxxxxxxxxxx# secret for signaturesecret: SEC000000000000000000000#alertmanager.yml 配置的通知路由webhook_legacy:url: https://oapi.dingtalk.com/robot/send?access_token='your token'# Customize template contentmessage:# Use legacy templatetitle: '{{ template "ding.link.title" . }}'text: '{{ template "ding.link.content" . }}'webhook_mention_all:url: https://oapi.dingtalk.com/robot/send?access_token=xxxxxxxxxxxxmention:all: truewebhook_mention_users:url: https://oapi.dingtalk.com/robot/send?access_token=xxxxxxxxxxxxmention:mobiles: ['156xxxx8827', '189xxxx8325']
cat prometheus-webhook-dingtalk-1.4.0.linux-amd64/contrib/templates/legacy/template2.tmpl
{{ define "__subject" }}[Linux 基础监控告警:{{ .Alerts.Firing | len }}] {{ end }}{{ define "__text_list" }}{{ range . }}{{ range .Labels.SortedPairs }}{{ if eq .Name "instance" }}* 实例:{{ .Value | html }}{{ end }}{{ end }}{{ range .Labels.SortedPairs }}{{ if eq .Name "serverity" }}* 告警级别:{{ .Value | html }}{{ end }}{{ if eq .Name "hostname" }}* 主机名称:{{ .Value | html }}{{ end }}{{ end }}{{ range .Annotations.SortedPairs }}{{ if eq .Name "description" }}* 告警详情:{{ .Value | html }}{{ end }}{{ end }}*触发时间: {{ (.StartsAt.Add 28800e9).Format "2006-01-02 15:04:05" }}{{"-------------------------------------------"}}{{ end }}{{ end }}{{ define "ding.link.title" }}{{ template "__subject" . }}{{ end }}{{ define "ding.link.content" }}{{ if gt (len .Alerts.Firing) 0 }}### 【 <font color=#FF0000>报警触发通知</font>】 [{{ .Alerts.Firing | len }}]{{ template "__text_list" .Alerts.Firing }}{{ end }}{{ if gt (len .Alerts.Resolved) 0 }}### 【 <font color=#32CD32>报警恢复</font>】 [{{ .Alerts.Resolved | len }}]{{ end }}{{ end }}
grafana
提供多种安装方式:https://grafana.com/docs/grafana/latest/installation/
推荐仪表盘插件:https://grafana.com/grafana/dashboards/8919
COPY ID 即可导入仪表盘:


若有收获,就点个赞吧
0 人点赞
