1. 安装ELK
本教程通过docker-compose部署elk,参考链接: https://github.com/deviantony/docker-elk
clone到本地(clone github加速:.com后加.cnpmjs.org):
git clone https://github.com.cnpmjs.org/deviantony/docker-elk.git
查看docker-compose.yml文件:
version: '3.2'services:elasticsearch:build:context: elasticsearch/args:ELK_VERSION: $ELK_VERSIONvolumes:- type: bindsource: ./elasticsearch/config/elasticsearch.ymltarget: /usr/share/elasticsearch/config/elasticsearch.ymlread_only: true- type: volumesource: elasticsearchtarget: /usr/share/elasticsearch/dataports:- "9200:9200"- "9300:9300"environment:ES_JAVA_OPTS: "-Xmx256m -Xms256m"ELASTIC_PASSWORD: changeme# Use single node discovery in order to disable production mode and avoid bootstrap checks.# see: https://www.elastic.co/guide/en/elasticsearch/reference/current/bootstrap-checks.htmldiscovery.type: single-nodenetworks:- elklogstash:build:context: logstash/args:ELK_VERSION: $ELK_VERSIONvolumes:- type: bindsource: ./logstash/config/logstash.ymltarget: /usr/share/logstash/config/logstash.ymlread_only: true- type: bindsource: ./logstash/pipelinetarget: /usr/share/logstash/pipelineread_only: trueports:- "5044:5044"- "5000:5000/tcp"- "5000:5000/udp"- "9600:9600"- "9900:9900"environment:LS_JAVA_OPTS: "-Xmx256m -Xms256m"networks:- elkdepends_on:- elasticsearchkibana:build:context: kibana/args:ELK_VERSION: $ELK_VERSIONvolumes:- type: bindsource: ./kibana/config/kibana.ymltarget: /usr/share/kibana/config/kibana.ymlread_only: trueports:- "5601:5601"networks:- elkdepends_on:- elasticsearchnetworks:elk:driver: bridgevolumes:elasticsearch:
kibana中文配置:vim ./kibana/config/kibana.yml
i18n.locale: "zh-CN"
启动并构建容器:
docker-compose up -d --build
启动成功:
访问kibana,5601端口:
这时我们只是部署了elk但是并没有数据源,别急,往下看。
2. 安装filebeat
我们首次登录时elastic会提醒我们是否导入数据源,由于我们使用的是centos,所以选择RPM包的方式安装:
curl -L -O https://artifacts.elastic.co/downloads/beats/filebeat/filebeat-7.12.0-x86_64.rpmsudo rpm -Uvh filebeat-7.12.0-x86_64.rpm
修改/etc/filebeat/filebeat.yml,配置输入源:
filebeat.inputs:# Each - is an input. Most options can be set at the input level, so# you can use different inputs for various configurations.# Below are the input specific configurations.# 这里收集nginx的访问日志和错误日志- type: logenabled: truepaths:- /var/log/nginx/access.logtags: ["access"] #打标签,在logstash建立索引判断时使用multiline: #多行合并,将不是{开头的合并成一行pattern: '^\{'negate: truematch: after- type: logenabled: truepaths:- /var/log/nginx/error.logtags: ["error"]
修改/etc/filebeat/filebeat.yml,配置输出源:
output.logstash:
  # 配置本机的logstash监听端口
  hosts: ["localhost:5044"]
启动并设置开机自启filebeat:
systemctl enable --now filebeat
3. 配置logstash
找到logstash配置文件,cat ./logstash/pipeline/logstash.conf
#配置输入源
input {
          beats {
                    port => 5044 #filebeat配置的logstash监听端口,这里beats可以监听所有Elastic
                             #提供的beats,不仅仅是filebeat
          }
        tcp {
                port => 9900 #这里是tcp的监听端口,本文没有使用
        }
}

#配置输出源
output {
    #刚刚在filebeat打的tag用于这里判断,logstash根据不同tag推送不同索引到es
    if "access" in [tags]{
        elasticsearch {
            hosts => "elasticsearch:9200"
        index => "nginx-access-%{+YYYY.MM.dd}"
            user => "elastic"
            password => "changeme"
       }
    }
    if "error" in [tags]{
         elasticsearch {
             hosts => "elasticsearch:9200"
         index => "nginx-error-%{+YYYY.MM.dd}"
             user => "elastic"
             password => "changeme"
        }
    }
    #这里是在另一台服务器filebeat收集的tomcat日志,配置方法同上
    if "tomcat" in [tags]{
         elasticsearch {
             hosts => "elasticsearch:9200"
         index => "tomcat-%{+YYYY.MM.dd}"
             user => "elastic"
             password => "changeme"
        }
    }
}
重启elk:
docker-compose restart
4. 使用Elastic Stack
Elastic Stack提供了丰富的功能,这里我们只介绍日志的查询功能。
本教程采用7.12的版本,该版本提供了两种日志查询方式:
一种是Analytics下的Discover
一种是Observability下的日志
4.1 探索Discover
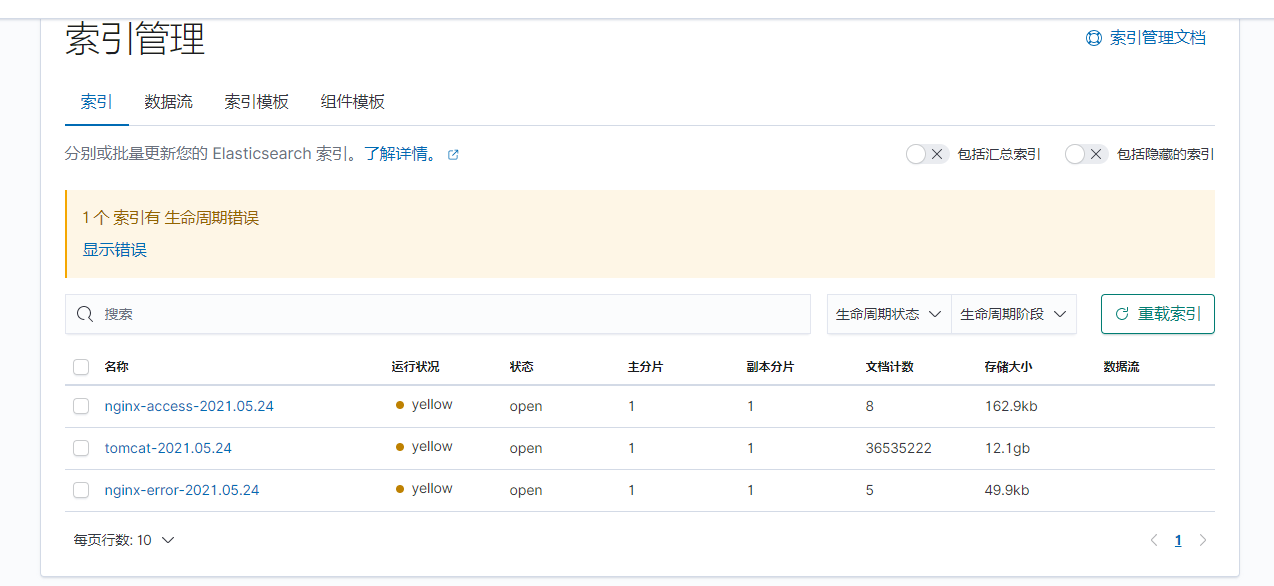
首先在 Stack Management 建立索引模式,如图,两个索引模式可以通配对应的索引:
进入Discover选择刚刚建立的索引,筛选message字段(日志内容):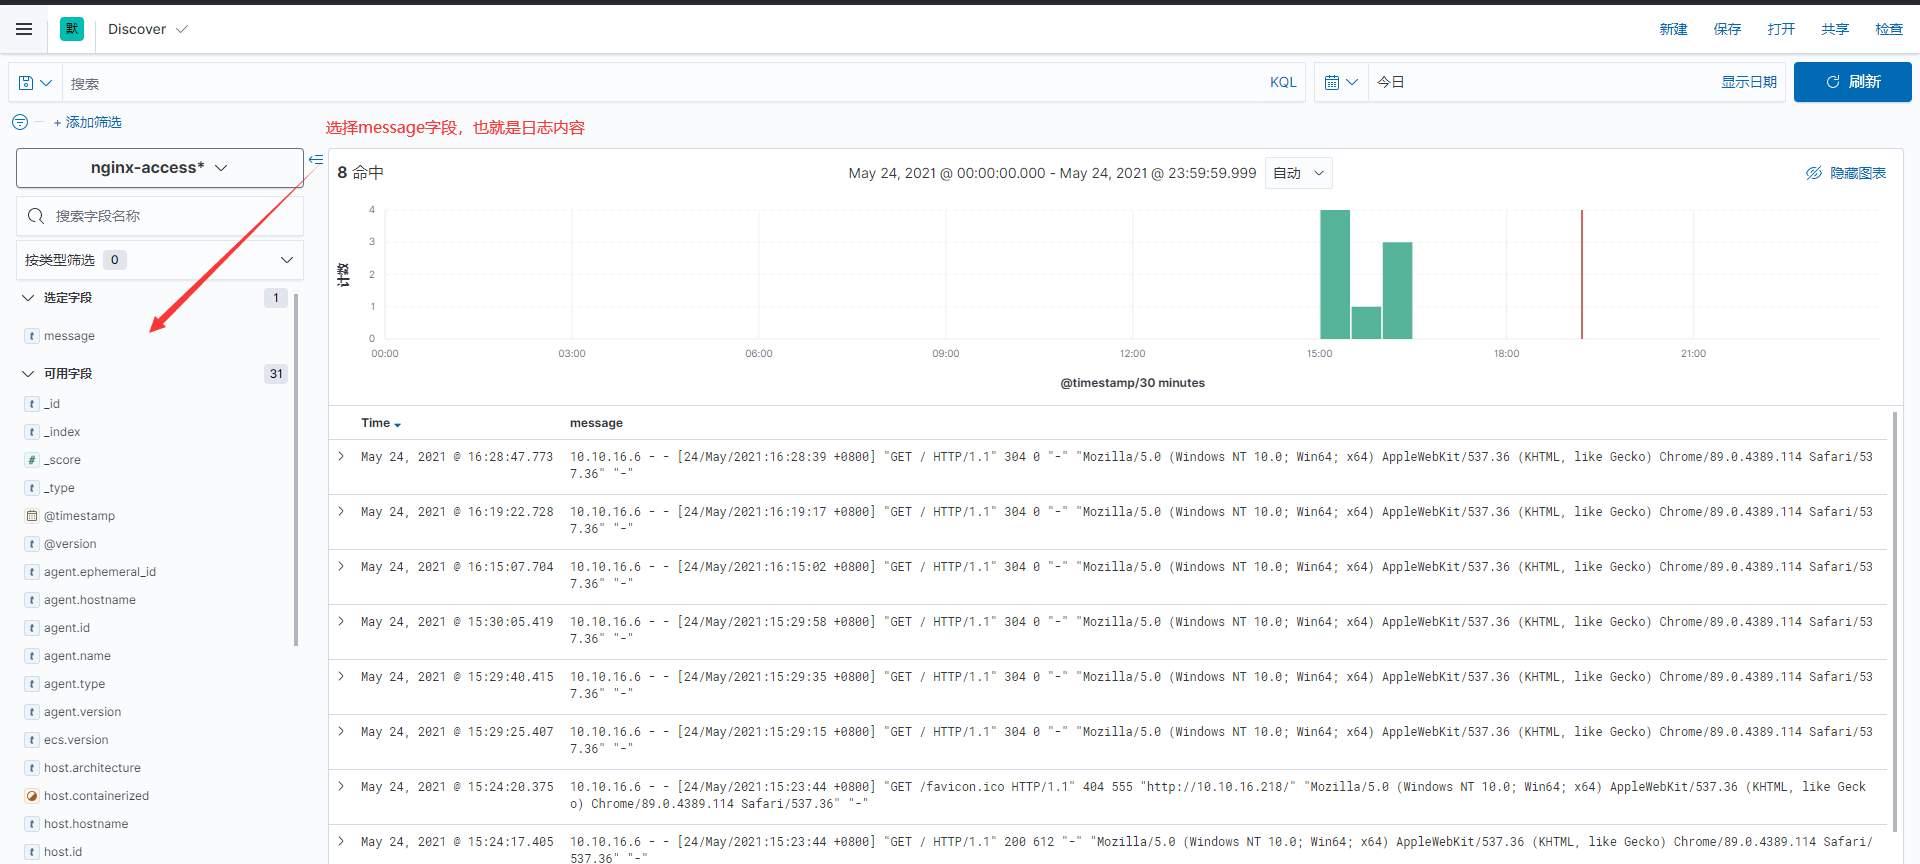
在KQL输入框我们可以使用KQL进行筛选,下面介绍几个常用的筛选语法:
#查询message中包含error字段
message: error

#查询message中包含error和open的字段
message: open and message:error

#查询message中包含error或者open的字段
message: open or message:error
我们可以将我们设置好的查询条件保存为自定义的搜索:
4.2 实时传输流日志
在Observability的日志中,我们可以查看实时传输的日志(有延迟但不高)
同样,在日志中我们可以通KQL语句查询对应的日志,例如:
#查询指定索引日志
_index: nginx-access-2021.05.24

#模糊匹配:
_index: nginx-*

#多条件查询
_index: nginx-error-* and message: error
以上可以说是初探ELK吧,如果日志数量过多我们可以加入Kafka、es集群来改良日志系统。后期有机会再写,拜拜了您勒!

若有收获,就点个赞吧
0 人点赞
