- 数据集加载
- 数据集的介绍:
使用的是yolo自己的数据集的格式,label第一列是分类,后面几类就是对应的bbox
2 0.751953 0.969727 0.0820312 0.0566406
1 0.984375 0.900391 0.0273438 0.0703125
1 0.915039 0.893555 0.0410156 0.0644531
1 0.952148 0.904297 0.0683594 0.0546875
1 0.232422 0.833008 0.0625 0.0566406
1 0.272461 0.835938 0.0644531 0.0546875
1 0.807617 0.0253906 0.0527344 0.050781
yolo的数据格式实际是:xywh 之后会转换成normalized [x1,y1,x2,y2]格式的数据,方法比较简单
yolo数据集格式转普通数据的方法: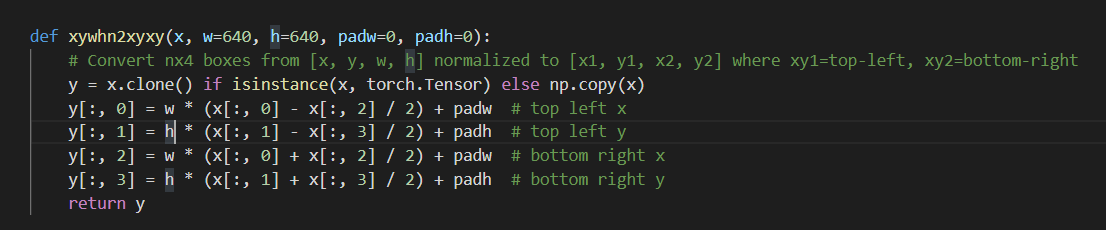
包含使用了cache文件 —> Cache images into memory for faster training
cachefile的数据格式:
x[‘im_file’]= [label, img_shape, segments] —> im_file是每个文件的路径
x[‘hash’]
x[‘results’] —> found, missing, empty, corrupted, total
x[‘version’]
dataset的get_item的输出:#输出的图片,输出的标签,图片的路径,图片的shapereturn torch.from_numpy(img), labels_out, self.img_files[index], shapes第一个就是0;类别;x;y;w;h (暂时还不知道为什么第一个放置0)[0.00000, 3.00000, 0.44662, 0.19930, 0.03818, 0.04437],[0.00000, 3.00000, 0.43784, 0.36595, 0.03302, 0.02889],
- 依赖于LoadImagesAndLabels函数,里面包含了数据的增强
还是用一些cutout的图像增强的方法,需要研究研究,针对于bbox是如些处理图像增强的,有个特殊的load_mosaic其实就是将一张图片和其他的3张图片拼凑在一起进行学习。然后里面还增加了一个随机透视变换的数据增强方式。
- 数据增强的方法:
- 随机透视变换的数据增强方式
- augment_hsv hsv数据增强
- yolo模型结构
yolo是将整张图分割成xx的cell,每个cell需要生成na个anchor,每个cell还需要预测(p1,p2,w,h,score)以及每个类的类别,所以输出就是(nc+5)na
下面这段代码是yaml的配置文件转换成model的方法
def parse_model(d, ch): # model_dict, input_channels(3)logger.info('\n%3s%18s%3s%10s %-40s%-30s' % ('', 'from', 'n', 'params', 'module', 'arguments'))anchors, nc, gd, gw = d['anchors'], d['nc'], d['depth_multiple'], d['width_multiple']# print('anchors, nc, gd, gw=>',anchors, nc, gd, gw) # [[10, 13, 16, 30, 33, 23], [30, 61, 62, 45, 59, 119], [116, 90, 156, 198, 373, 326]] 4 0.33 0.5na = (len(anchors[0]) // 2) if isinstance(anchors, list) else anchors # number of anchors 一个cell生成几个anchorsno = na * (nc + 5) # number of outputs = anchors * (classes + 5)layers, save, c2 = [], [], ch[-1] # layers, savelist, ch outfor i, (f, n, m, args) in enumerate(d['backbone'] + d['head']): # from, number, module, argsm = eval(m) if isinstance(m, str) else m # eval stringsfor j, a in enumerate(args):try:args[j] = eval(a) if isinstance(a, str) else a # eval stringsexcept:passn = max(round(n * gd), 1) if n > 1 else n # depth gainif m in [Conv, GhostConv, Bottleneck, GhostBottleneck, SPP, DWConv, MixConv2d, Focus, CrossConv, BottleneckCSP, C3]:c1, c2 = ch[f], args[0]if c2 != no: # if not outputc2 = make_divisible(c2 * gw, 8)args = [c1, c2, *args[1:]]if m in [BottleneckCSP, C3]:args.insert(2, n) # number of repeatsn = 1elif m is nn.BatchNorm2d:args = [ch[f]]elif m is Concat:c2 = sum([ch[x] for x in f])elif m is Detect:print('Detect=>',f,'ch=>',ch)args.append([ch[x] for x in f])if isinstance(args[1], int): # number of anchorsargs[1] = [list(range(args[1] * 2))] * len(f)elif m is Contract:c2 = ch[f] * args[0] ** 2elif m is Expand:c2 = ch[f] // args[0] ** 2else:c2 = ch[f]m_ = nn.Sequential(*[m(*args) for _ in range(n)]) if n > 1 else m(*args) # modulet = str(m)[8:-2].replace('__main__.', '') # module typenp = sum([x.numel() for x in m_.parameters()]) # number paramsm_.i, m_.f, m_.type, m_.np = i, f, t, np # attach index, 'from' index, type, number paramslogger.info('%3s%18s%3s%10.0f %-40s%-30s' % (i, f, n, np, t, args)) # printsave.extend(x % i for x in ([f] if isinstance(f, int) else f) if x != -1) # append to savelistlayers.append(m_)if i == 0:ch = []ch.append(c2)return nn.Sequential(*layers), sorted(save)
模型结构: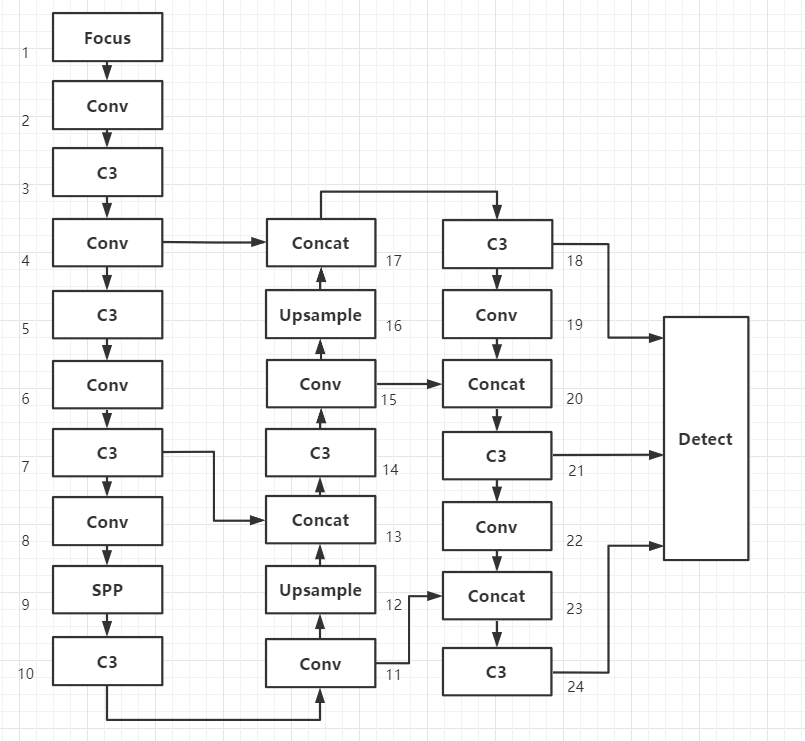
- 损失函数的计算
如何计算损失函数:compute_loss(pred, targets.to(device)) 传入的参数就是shape为6的标签数据[0.00000, 3.00000, 0.44662, 0.19930, 0.03818, 0.04437]
computer_loss(pred,gt)
预测值的大小如下pred = ``[16, 3, 80, 80, 9] -> [16, 3, 40, 40, 9] -> [16, 3, 20, 20, 9]gt = label_out [0.00000, 3.00000, 0.43784, 0.36595, 0.03302, 0.02889]

若有收获,就点个赞吧
0 人点赞
