我们知道,在 MySQL 中,存储引擎是通过插件实现的,从而使得添加存储引擎时相对来说比较简单,而且目前支持多种类型的存储引擎。
InnoDB 目前基本上已经是实时上的没人存储引擎了,现在可以支持外键、行锁、MVCC、支持标准的 4 种隔离级别等等。实际上,这也就意味着 InnoDB 是相当复杂的一个存储引擎。
简介
在 MySQL 中,现仍然使用 InnoDB,而在 MariaDB 中,使用 XtraDB 替换了 InnoDB,但是仍然显示为 InnoDB,可以通过 show engines 查看,不知道后面会不会给换掉。
另一个比较不错的存储引擎是 Percona 开发的 TokuDB,还没有仔细研究过,暂时标记下。
InnoDB 特性
InnoDB 采用的 索引组织表,也就是采用唯一且非空的主键进行组织,主健可以为多个字段;如果没有定义主键,则会选择第一个非空的唯一索引;如果没有符合条件的索引则会使用一个隐含的 6-bytes 递增字段。
堆组织表(Heap Organized Table, HOT),数据会以堆的方式进行管理,插入数据时,会使用第一个能放下此数据的空闲空间。索引组织表(Index Organized Table, IOT),数据按主键进行存储和排序。
Oracle 支持堆表以及索引组织表;PostgreSQL 只支持堆表;InnoDB 只支持索引组织表。
上述的索引 (主健) 称为聚集索引 (Clustered Index),除了聚集索引之外的其它索引都被称为二级索引 (Secondary Index),二级索引还会保存对应的聚集索引,因此通常来说聚集索引不要太长。
索引是以 B+Tree 组织,对磁盘读取的最小单位为页 (Page),默认大小是 16KB。页的大小可以在创建实例时通过 innodb_page_size 参数设置,创建之后不能修改,不同页大小之间的实例不兼容。
当新记录插入时,会预留 1KB 为以后插入时使用。如果是顺序插入(升序或者降序),则一般会占用 15/16,对于随机插入则会在 1/2~15/16 之间,小于 1/2 则尝试合并删除。
常用操作
InnoDB 相关的操作。
mysql> SHOW ENGINES; ← 查看现在支持的存储引擎。
mysql> SELECT * FROM informationschema.engines; ← 功能同上
mysql> SHOW VARIABLES LIKE ‘innodb_version’; ← innodb的版本
mysql> SHOW VARIABLES LIKE ‘innodb%_io_threads’; ← io线程
mysql> SHOW VARIABLES LIKE ‘innodb_purge_threads’; ← purge线程
mysql> SHOW VARIABLES LIKE ‘innodb_buffer_pool_size’; ← 缓冲池大小
mysql> SHOW VARIABLES LIKE ‘innodb_buffer_pool_instances’; ← 缓冲池实例数目
mysql> SHOW ENGINE INNODB STATUS\G ← 详细状态
文件管理
MySQL 的各种数据保存在 datadir 变量指定的目录下,使用 OS 的文件系统;其中,表结构保存在数据库的目录下,文件为 .frm,但是 InnoDB 同时会在表空间中保存表的元数据,显然不能通过删除 .frm 来删除表,暂没有尝试过对其它的存储引擎直接删除 *.frm 。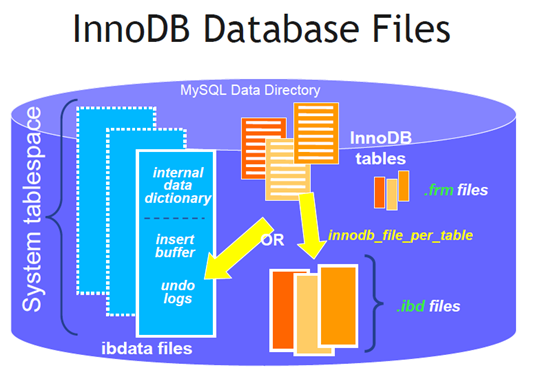
各个文件的详细介绍如下:
- ibdata1,系统表空间包括了 Undo log、Double Write Buffer、Insert Buffer 等,可以通过 innodb_data_file_path 变量查看文件名称和大小。
- ib_logfile0/1,redo-log日志InnoDB 的 redo-log ,顺序写入,循环利用。
- db-name/,与数据库名称相同的目录除了 information_schema 之外,每个数据库都有一个相同名称的目录,而 information_schema 实际上是一个视图,提供了访问元数据的一个接口,因此没有保存与之相关的文件。
- db-name/db.opt,文本文件每个目录下都会保存一个 db.opt 文本文件,用来保存该库的默认字符集编码和字符集排序规则。在创建表时,如果没有指定字符集和排序规则,那么该新建的表将采用 db.opt 文件中指定的属性。
- db-name/table-name.frm,MySQL 表的元数据,与 InnoDB 无关同时每个数据库对应的目录下都会保存一个 table-name.frm,与存储引擎无关,用来保存表的元数据。
- db-name/table-name.idb对于 innodb,如果采用共享表空间,则索引、数据等信息会保存在 ibdataN 中;如果采用独立表空间则会保存在目录下 table-name.idb。
- db-name/{table-name.MYD,table-name.MYI}.MYD 文件用来存储 MyISAM 的数据,.MYI 用来存储索引相关的信息。
对于表的存储格式,实际上 Google 的 Jeremy Cole 对此介绍的已经很详细,可以直接参考其 blog,后面也会有对这方面的解析,仅记录个人对此的理解。
状态查看
show engine
通过如下命令可以查看当前 InnoDB 的状态。
mysql> SHOW ENGINE INNODB STATUS\G
* 1. row *
Type: InnoDB
Name:
Status:
=====================================
2016-12-11 09:07:11 7fc8552f4b00 INNODB MONITOR OUTPUT
=====================================
Per second averages calculated from the last 3 seconds
————————-
BACKGROUND THREAD
————————-
srv_master_thread loops: 1 srv_active, 0 srv_shutdown, 78844 srv_idle
srv_master_thread log flush and writes: 78845
—————
SEMAPHORES
—————
—————
MUTEX INFO
—————
Locked mutex: addr 0x7fc8586c6a40 thread 140498399349504 file handler/ha_innodb.cc line 15729
Locked mutex: addr 0x7fc8586c69c0 thread 140498399349504 file srv/srv0srv.cc line 1397
Total number of mutexes 8370
——————-
RW-LATCH INFO
——————-
Total number of rw-locks 16434
OS WAIT ARRAY INFO: reservation count 5
OS WAIT ARRAY INFO: signal count 5
Mutex spin waits 975, rounds 1472, OS waits 2
RW-shared spins 2, rounds 60, OS waits 2
RW-excl spins 0, rounds 0, OS waits 0
Spin rounds per wait: 1.51 mutex, 30.00 RW-shared, 0.00 RW-excl
——————
TRANSACTIONS
——————
Trx id counter 95236
Purge done for trx’s n:o < 94832 undo n:o < 0 state: running but idle
History list length 545
Total number of lock structs in row lock hash table 0
LIST OF TRANSACTIONS FOR EACH SESSION:
—-TRANSACTION 0, not started
MySQL thread id 53, OS thread handle 0x7fc8552f4b00, query id 600031 localhost 127.0.0.1 root init
SHOW ENGINE INNODB STATUS
—-TRANSACTION 95235, not started
MySQL thread id 1, OS thread handle 0x7fc856e58b00, query id 0 Waiting for background binlog tasks
————
FILE I/O
————
I/O thread 0 state: waiting for i/o request (insert buffer thread)
I/O thread 1 state: waiting for i/o request (log thread)
I/O thread 2 state: waiting for i/o request (read thread)
I/O thread 3 state: waiting for i/o request (read thread)
I/O thread 4 state: waiting for i/o request (read thread)
I/O thread 5 state: waiting for i/o request (read thread)
I/O thread 6 state: waiting for i/o request (write thread)
I/O thread 7 state: waiting for i/o request (write thread)
I/O thread 8 state: waiting for i/o request (write thread)
I/O thread 9 state: waiting for i/o request (write thread)
Pending normal aio reads: 0 [0, 0, 0, 0] , aio writes: 0 [0, 0, 0, 0] ,
ibuf aio reads: 0, log i/o’s: 0, sync i/o’s: 0
Pending flushes (fsync) log: 0; buffer pool: 0
357 OS file reads, 5 OS file writes, 5 OS fsyncs
0.00 reads/s, 0 avg bytes/read, 0.00 writes/s, 0.00 fsyncs/s
——————————————————-
INSERT BUFFER AND ADAPTIVE HASH INDEX
——————————————————-
Ibuf: size 1, free list len 0, seg size 2, 0 merges
merged operations:
insert 0, delete mark 0, delete 0
discarded operations:
insert 0, delete mark 0, delete 0
0.00 hash searches/s, 0.00 non-hash searches/s
—-
LOG
—-
Log sequence number 47392436
Log flushed up to 47392436
Pages flushed up to 47392436
Last checkpoint at 47392436
Max checkpoint age 80826164
Checkpoint age target 78300347
Modified age 0
Checkpoint age 0
0 pending log writes, 0 pending chkp writes
8 log i/o’s done, 0.00 log i/o’s/second
———————————
BUFFER POOL AND MEMORY
———————————
Total memory allocated 141033472; in additional pool allocated 0
Total memory allocated by read views 88
Internal hash tables (constant factor + variable factor)
Adaptive hash index 2233968 (2213368 + 20600)
Page hash 139112 (buffer pool 0 only)
Dictionary cache 618319 (554768 + 63551)
File system 819088 (812272 + 6816)
Lock system 333624 (332872 + 752)
Recovery system 0 (0 + 0)
Dictionary memory allocated 63551
Buffer pool size 8191
Buffer pool size, bytes 134201344
Free buffers 7856
Database pages 334
Old database pages 0
Modified db pages 0
Percent of dirty pages(LRU & free pages): 0.000
Max dirty pages percent: 75.000
Pending reads 0
Pending writes: LRU 0, flush list 0, single page 0
Pages made young 0, not young 0
0.00 youngs/s, 0.00 non-youngs/s
Pages read 334, created 0, written 1
0.00 reads/s, 0.00 creates/s, 0.00 writes/s
No buffer pool page gets since the last printout
Pages read ahead 0.00/s, evicted without access 0.00/s, Random read ahead 0.00/s
LRU len: 334, unzip_LRU len: 0
I/O sum[0]:cur[0], unzip sum[0]:cur[0]
———————
ROW OPERATIONS
———————
0 queries inside InnoDB, 0 queries in queue
0 read views open inside InnoDB
0 RW transactions active inside InnoDB
0 RO transactions active inside InnoDB
0 out of 1000 descriptors used
Main thread process no. 6432, id 140497645459200, state: sleeping
Number of rows inserted 0, updated 0, deleted 0, read 0
0.00 inserts/s, 0.00 updates/s, 0.00 deletes/s, 0.00 reads/s
Number of system rows inserted 0, updated 0, deleted 0, read 0
0.00 inserts/s, 0.00 updates/s, 0.00 deletes/s, 0.00 reads/s
——————————————
END OF INNODB MONITOR OUTPUT
============================
源码实现
上述命令会调用存储引擎中定义的 show_status() 接口,对于 InnoDB 来说,调用逻辑如下。
// 初始化为相应的函数 static int innobase_init(void *p)
{
… …
innobase_hton->show_status = innobase_show_status;
… …
}
然后,其调用流程如下,也就是最终调用的是 srv_printf_innodb_monitor() 函数。
innobase_show_status() ← handler/ha_innodb.cc
|-innodb_show_status()
|-srv_printf_innodb_monitor() ← 实际打印函数入口,srv/srv0srv.cc
|-lock_print_info_summary() ← 打印锁相关信息
|-log_print() ← LOG,redo日志相关
innodb_metrics
从 MySQL 5.6 开始,引入了 informationschema.innodb_metrics 表,包含了比 show global status 更详细的内容,而且相比 performance_schema 更轻量级。
八卦下,据说 innodb_metrics 表是在 Oracle-Sun 谈判的时候,所以就只实现了这一个表 ^^
该表中包括了,页的分裂和合并、Purge 的性能、Adaptive Hash Index 活动、页的刷新、日志刷新、Index Condition Pushdown(ICP) 等等;监控那些指标可以分别控制。
InnoDB 中提供了如下的变量,可以对表内的参数进行设置。
——- 查看可以使用的变量
mysql> SHOW GLOBAL VARIABLES LIKE ‘innodbmonitor%’;
+—————————————+———-+
| Variable_name | Value |
+—————————————+———-+
| innodb_monitor_disable | |
| innodb_monitor_enable | |
| innodb_monitor_reset | |
| innodb_monitor_reset_all | |
+—————————————+———-+
4 rows in set (0.00 sec)
——- 查看当前的监控指标
mysql> SELECT name,subsystem,status,type,comment FROM information_schema.innodb_metrics;
——- 开启一个指标项
mysql> SET GLOBAL innodbmonitor_enable=’buffer_pool_reads’;
——- 关闭一个指标项
mysql> SET GLOBAL innodb_monitor_disable=’buffer_pool_reads’;
——- 重置参数,只重置XXX_RESET列参数
mysql> SET GLOBAL innodb_monitor_reset=’buffer_pool_reads’;
——- 重置所有参数,会重置所有参数
mysql> SET GLOBAL innodb_monitor_reset_all=’buffer_pool_reads’;
——- 也可以使用通配符
mysql> SET GLOBAL innodb_monitor_enable=’buffer_pool%’;
可以参考 Reference Manual 以及 Get started with InnoDB Metrics Table 。
源码解析
监控的源码实现在 storage/innobase/srv/srv0mon.cc 文件中,通过如下变量进行统计。
static monitor_info_t innodb_counter_info[] =
{
/ A dummy item to mark the module start, this is to accomodate the default value (0) set for the global variables with the control system. /
{“module_start”, “module_start”, “module_start”,
MONITOR_MODULE,
MONITOR_DEFAULT_START, MONITOR_DEFAULT_START},
… …
{“buffer_flush_background_pages”, “buffer”,
“Pages queued as a background batch”,
MONITOR_SET_MEMBER, MONITOR_FLUSH_BACKGROUND_TOTAL_PAGE,
MONITOR_FLUSH_BACKGROUND_PAGES},
… …
};
计数器在那里增加,可以通过最后的一个宏定义查看,如上述 MONITOR_FLUSH_BACKGROUND_PAGES。
其它
在 MySQL 中设置与 InnoDB 相关的变量时,实际对应到源码后是将变量中的 innodb 替换为了 srv ,例如 innodb_read_ahead_threshold 对应到源码中是 srv_read_ahead_threshold 。

若有收获,就点个赞吧
0 人点赞
