1. 部署
1.1 下载源码
git clone https://github.com/prometheus-operator/kube-prometheus.gitcd kube-prometheus
注意:请确认好**Kubernetes**集群版本,下载对应版本的源码包。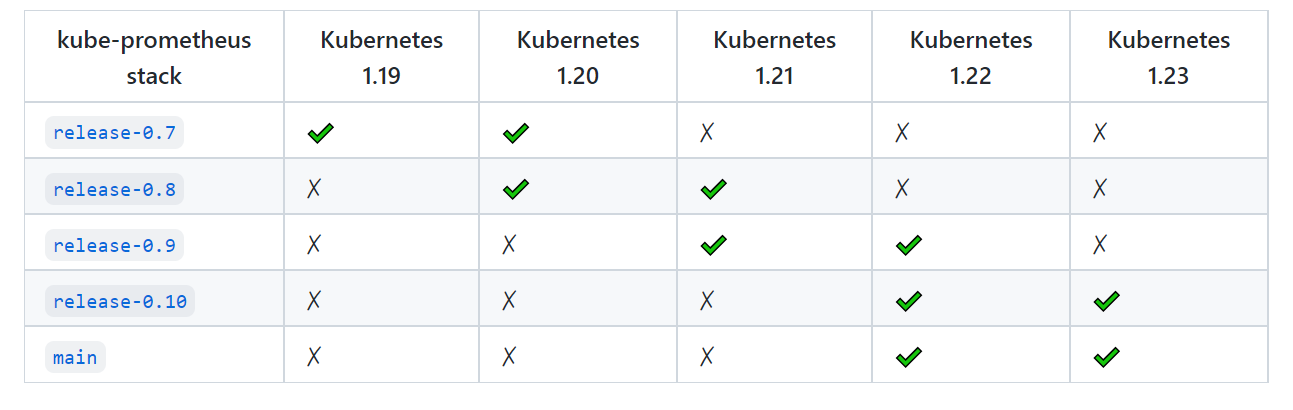
1.2 修改yaml
主要是修改一下Service的类型和镜像源。默认Service为ClusterIP,为了提供一个集群访问入口,这里设置为NodeProt类型,如果是在云服务上部署的,可以改成LoadBalancer;另外就是有几个服务的镜像源为谷歌的镜像仓库,国内无法访问,因此需要更换一下镜像。
1.2.1 修改grafana-service.yaml
sed -i '/spec:/a\ type: NodePort' manifests/grafana-service.yaml
1.2.2 修改prometheus-service.yaml
sed -i '/spec:/a\ type: NodePort' manifests/prometheus-service.yaml
1.2.3 修改alertmanager-service.yaml
sed -i '/spec:/a\ type: NodePort' manifests/alertmanager-service.yaml
1.2.4 修改镜像源
查看包含image的yaml文件:grep -l image: manifests/*.yaml
sed -ri 's#(image:) k8s.*#\1 bitnami/kube-state-metrics:2.4.2#' manifests/kubeStateMetrics-deployment.yamlsed -ri 's#(image:) k8s.*#\1 willdockerhub/prometheus-adapter:v0.9.1#' manifests/prometheusAdapter-deployment.yaml
1.3 部署 CRD
kubectl create -f manifests/setup
注意:使用**apply**时会提示以下错误,可以使用**create**代替。
The CustomResourceDefinition "prometheuses.monitoring.coreos.com" is invalid: metadata.annotations: Too long: must have at most 262144 bytes
1.4 部署 Prometheus 生态组件
注意:默认为高可用部署,即关键组件都会启动多个副本,副本数请按需修改。
kubectl apply -f manifests
查看部署情况:
[root@k8s-master01 ~]# kubectl get pod -n monitoringNAME READY STATUS RESTARTS AGEalertmanager-main-0 2/2 Running 0 35mblackbox-exporter-5cb5d7479d-n59tf 3/3 Running 0 42mgrafana-d595885ff-6gg6t 1/1 Running 0 42mkube-state-metrics-d64589d79-hwx7j 3/3 Running 0 42mnode-exporter-9l7k5 2/2 Running 0 42mnode-exporter-fm78w 2/2 Running 0 42mnode-exporter-tw54d 2/2 Running 0 42mprometheus-adapter-86df476d87-27dp4 1/1 Running 0 42mprometheus-adapter-86df476d87-65dfz 1/1 Running 0 42mprometheus-k8s-0 2/2 Running 0 35mprometheus-operator-7cc5c6fd68-xfkfh 2/2 Running 0 42m[root@k8s-master01 ~]# kubectl get svc -n monitoringNAME TYPE CLUSTER-IP EXTERNAL-IP PORT(S) AGEalertmanager-main ClusterIP 10.109.19.210 <none> 9093/TCP,8080/TCP 64malertmanager-operated ClusterIP None <none> 9093/TCP,9094/TCP,9094/UDP 57mblackbox-exporter ClusterIP 10.99.75.89 <none> 9115/TCP,19115/TCP 64mgrafana NodePort 10.99.120.219 <none> 3000:32287/TCP 64mkube-state-metrics ClusterIP None <none> 8443/TCP,9443/TCP 64mnode-exporter ClusterIP None <none> 9100/TCP 64mprometheus-adapter ClusterIP 10.103.205.208 <none> 443/TCP 64mprometheus-k8s NodePort 10.99.26.234 <none> 9090:30447/TCP,8080:30361/TCP 64mprometheus-operated ClusterIP None <none> 9090/TCP 57mprometheus-operator ClusterIP None <none> 8443/TCP 64m

若有收获,就点个赞吧
0 人点赞
