前置条件
当前 datakit 版本 1.4.0
当前案例使用 ddtrace 版本0.78.3和 0.97.0(最新版本)进行测试
开启 ddtrace 采集
# {"version": "1.4.1", "desc": "do NOT edit this line"}[[inputs.ddtrace]]## DDTrace Agent endpoints register by version respectively.## Endpoints can be skipped listen by remove them from the list.## Default value set as below. DO NOT MODIFY THESE ENDPOINTS if not necessary.endpoints = ["/v0.3/traces", "/v0.4/traces", "/v0.5/traces"]## customer_tags is a list of keys contains keys set by client code like span.SetTag(key, value)## that want to send to data center. Those keys set by client code will take precedence over## keys in [inputs.ddtrace.tags]. DOT(.) IN KEY WILL BE REPLACED BY DASH(_) WHEN SENDING.# customer_tags = ["key1", "key2", ...]## Keep rare tracing resources list switch.## If some resources are rare enough(not presend in 1 hour), those resource will always send## to data center and do not consider samplers and filters.# keep_rare_resource = false## By default every error presents in span will be send to data center and omit any filters or## sampler. If you want to get rid of some error status, you can set the error status list here.# omit_err_status = ["404"]## Ignore tracing resources map like service:[resources...].## The service name is the full service name in current application.## The resource list is regular expressions uses to block resource names.## If you want to block some resources universally under all services, you can set the## service name as "*". Note: double quotes "" cannot be omitted.# [inputs.ddtrace.close_resource]# service1 = ["resource1", "resource2", ...]# service2 = ["resource1", "resource2", ...]# "*" = ["close_resource_under_all_services"]# ...## Sampler config uses to set global sampling strategy.## priority uses to set tracing data propagation level, the valid values are -1, 0, 1## -1: always reject any tracing data send to datakit## 0: accept tracing data and calculate with sampling_rate## 1: always send to data center and do not consider sampling_rate## sampling_rate used to set global sampling rate#[inputs.ddtrace.sampler]# priority = -1# sampling_rate = 0## Piplines use to manipulate message and meta data. If this item configured right then## the current input procedure will run the scripts wrote in pipline config file against the data## present in span message.## The string on the left side of the equal sign must be identical to the service name that## you try to handle.# [inputs.ddtrace.pipelines]# service1 = "service1.p"# service2 = "service2.p"# ...# [inputs.ddtrace.tags]# key1 = "value1"# key2 = "value2"# ...
准备 Shell
java -javaagent:D:/ddtrace/dd-java-agent-0.97.0.jar \-Ddd.service=ddtrace-server \-Ddd.agent.port=9529 \-jar springboot-ddtrace-server.jar
开启 Query 参数
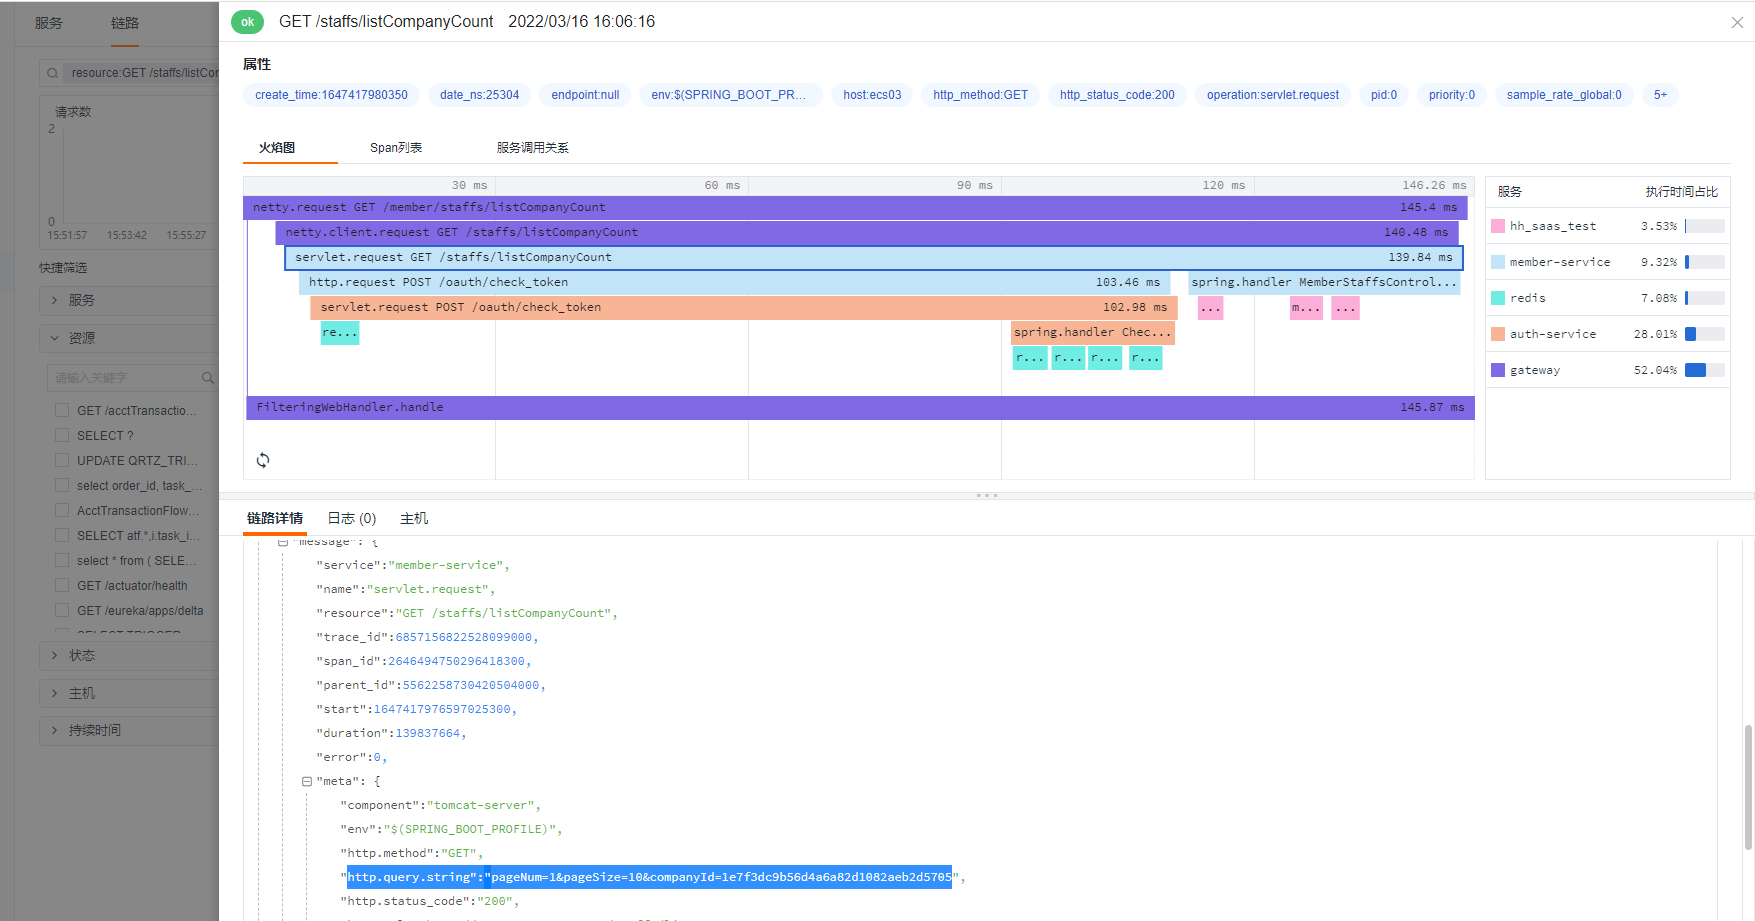
开启 query 参数,可以更直观方便的让用户看到当前请求携带了哪些参数,更直观的还原客户真实操作流程,但 query 开启参数只能采集到 url 上的参数,request Body 里面的参数目前尚不支持。默认为 false,表示为默认不开启。
-Ddd.http.server.tag.query-string=TRUE
配置远程采集链接
dd.agent.host 默认值是localhost,所以默认推送的是本地的 DataKit ,如果想推送远程 DataKit ,则需要配置 dd.agent.host。
-Ddd.agent.host=192.168.91.11
类或方法注入 Trace
ddtrace 支持给方法注入 Trace ,默认情况下,ddtrace 会对所有的 API 接口动态注入 Trace,如果想对非 API 类(方法)——一些重要的类和方法需要重点标记,可以通过 dd.trace.methods参数配置。
Environment Variable: DD_TRACE_METHODS
Default: null
Example: package.ClassName[method1,method2,…];AnonymousClass$1[call];package.ClassName[]
List of class/interface and methods to trace. Similar to adding @Trace, but without changing code. Note: The wildcard method support ([]) does not accommodate constructors, getters, setters, synthetic, toString, equals, hashcode, or finalizer method calls
如对com.zy.observable.ddtrace.service.TestService 类的getDemo方法需要添加 Trace。
-Ddd.trace.methods=”com.zy.observable.ddtrace.service.TestService[getDemo]”
部分代码所示:
@Autowiredprivate TestService testService;@GetMapping("/gateway")@ResponseBodypublic String gateway(String tag) {String userId = "user-" + System.currentTimeMillis();MDC.put(ConstantsUtils.MDC_USER_ID, userId);logger.info("this is tag");sleep();testService.getDemo();httpTemplate.getForEntity(apiUrl + "/resource", String.class).getBody();httpTemplate.getForEntity(apiUrl + "/auth", String.class).getBody();if (client) {httpTemplate.getForEntity("http://"+extraHost+":8081/client", String.class).getBody();}return httpTemplate.getForEntity(apiUrl + "/billing?tag=" + tag, String.class).getBody();}
未添加dd.trace.methods参数,上报 11 个 span ,效果如下: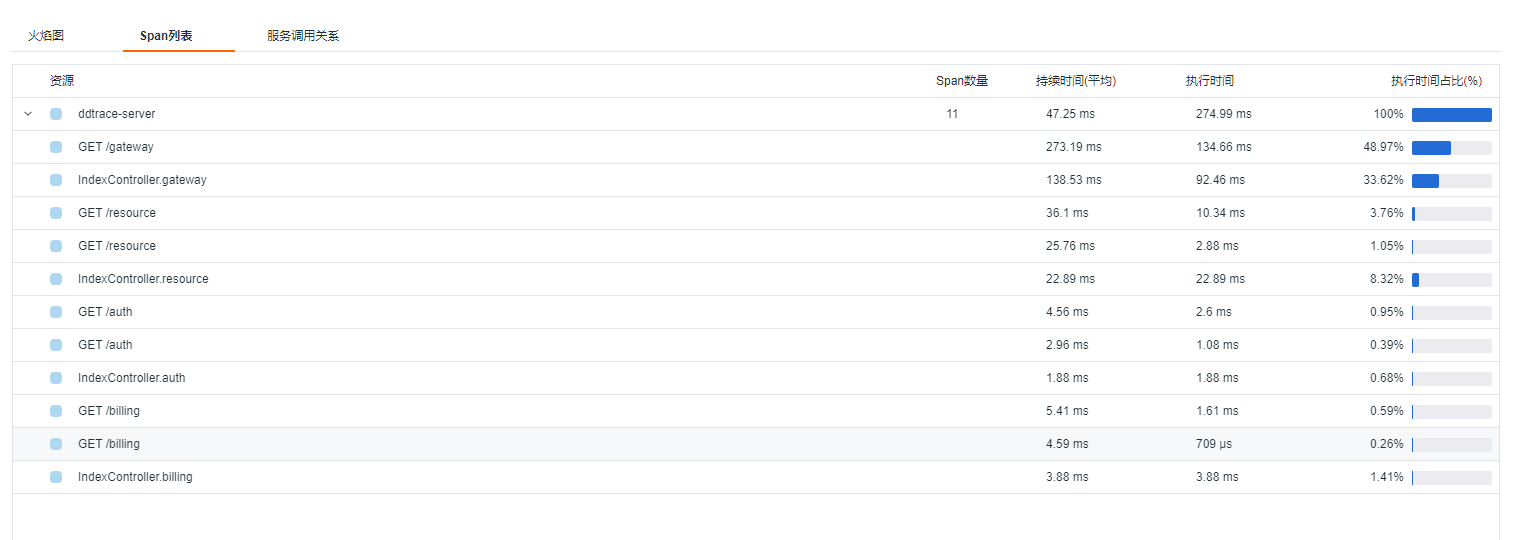
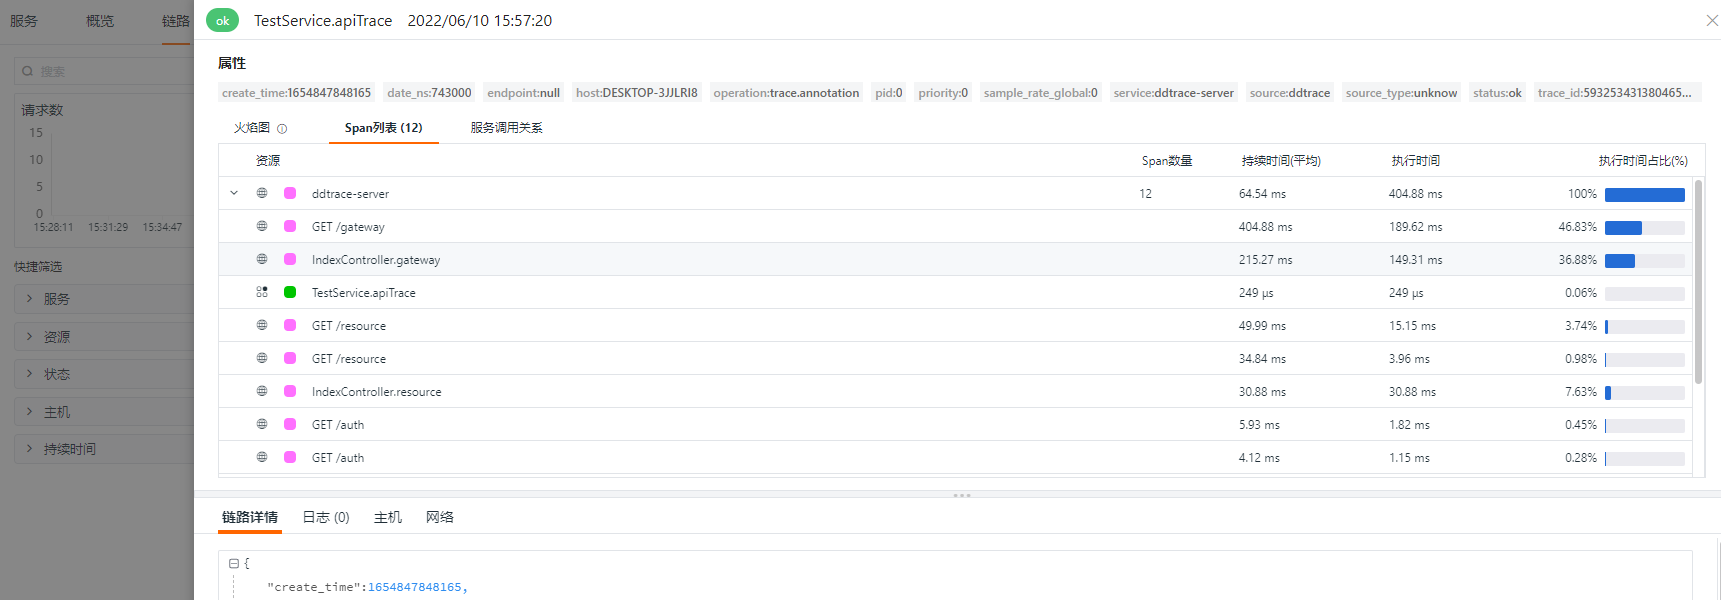
添加dd.trace.methods参数,上报 12 个 span ,效果如下: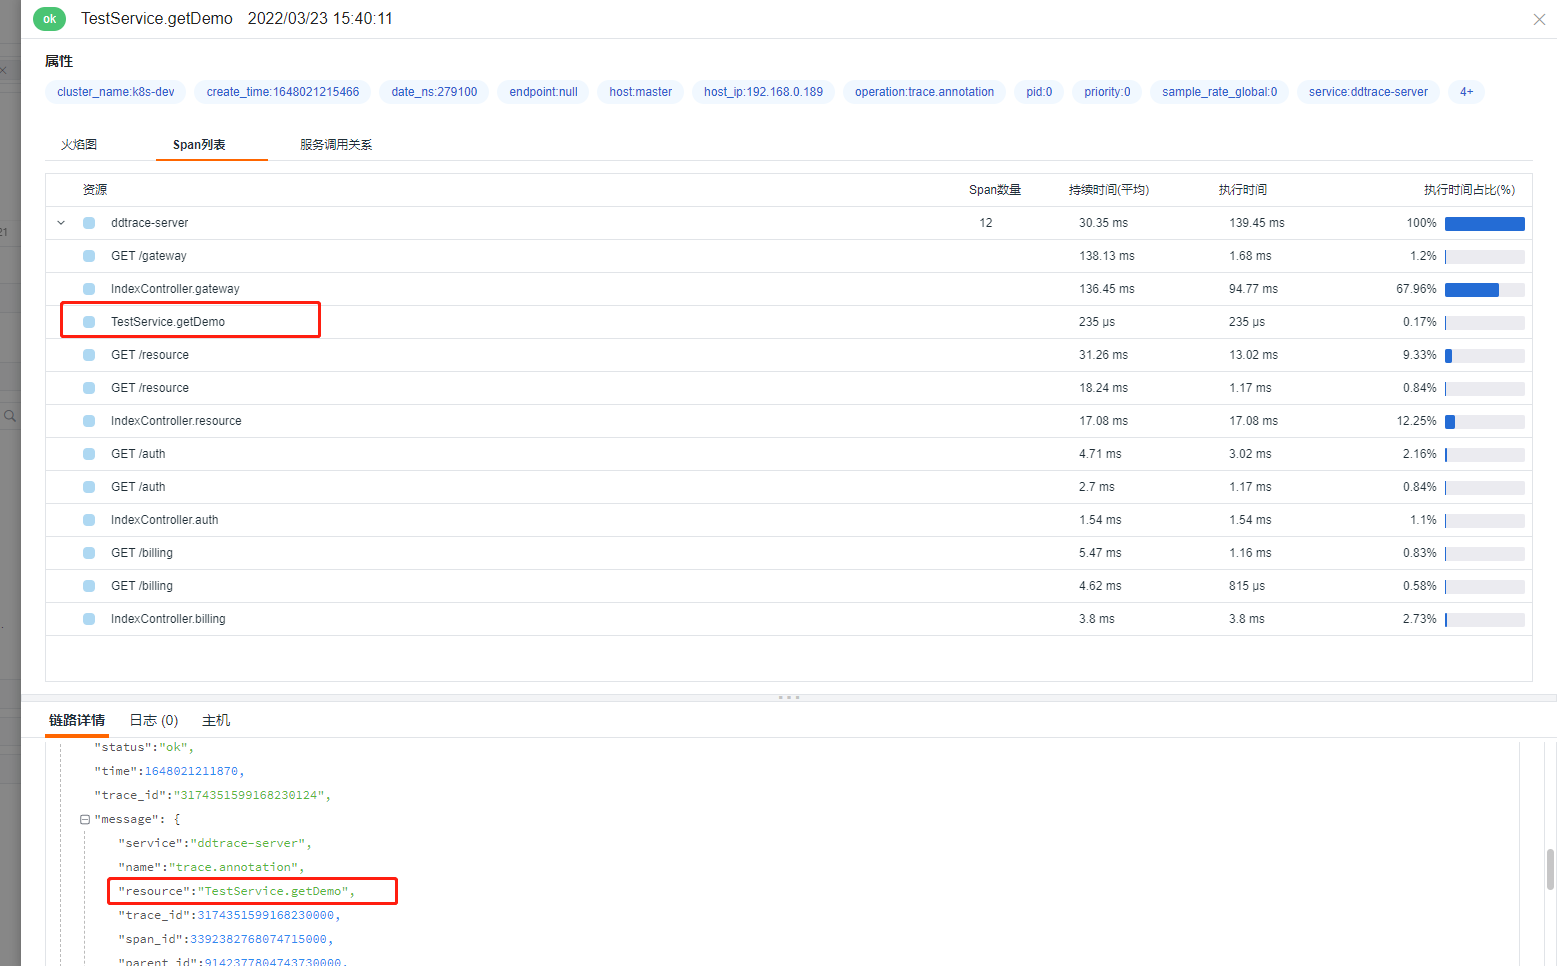
忽略 Trace(实测无效)
通过配置dd.trace.classes.exclude可以忽略我们不愿意上报的 trace 数据,在实际生产环境中,比如注册中心的心跳。
Environment Variable: DD_TRACE_CLASSES_EXCLUDE
Default: null
Example: package.ClassName,package.ClassName$Nested,package.Foo,package.other.
A list of fully qualified classes (that may end with a wildcard to denote a prefix) which will be ignored (not modified) by the tracer. Must use the jvm internal representation for names (eg package.ClassName$Nested and not package.ClassName.Nested)
忽略 IndexController产生的 trace,配置入下:
-Ddd.trace.classes.exclude=”com.zy.observable.ddtrace.controller.IndexController”
然而并没有达到既定的效果。
两种添加 Tag 方式
ddtrace 提供两种添加 tag 方式,效果一样。但还是推荐使用 dd.tags 方式
dd.trace.span.tags
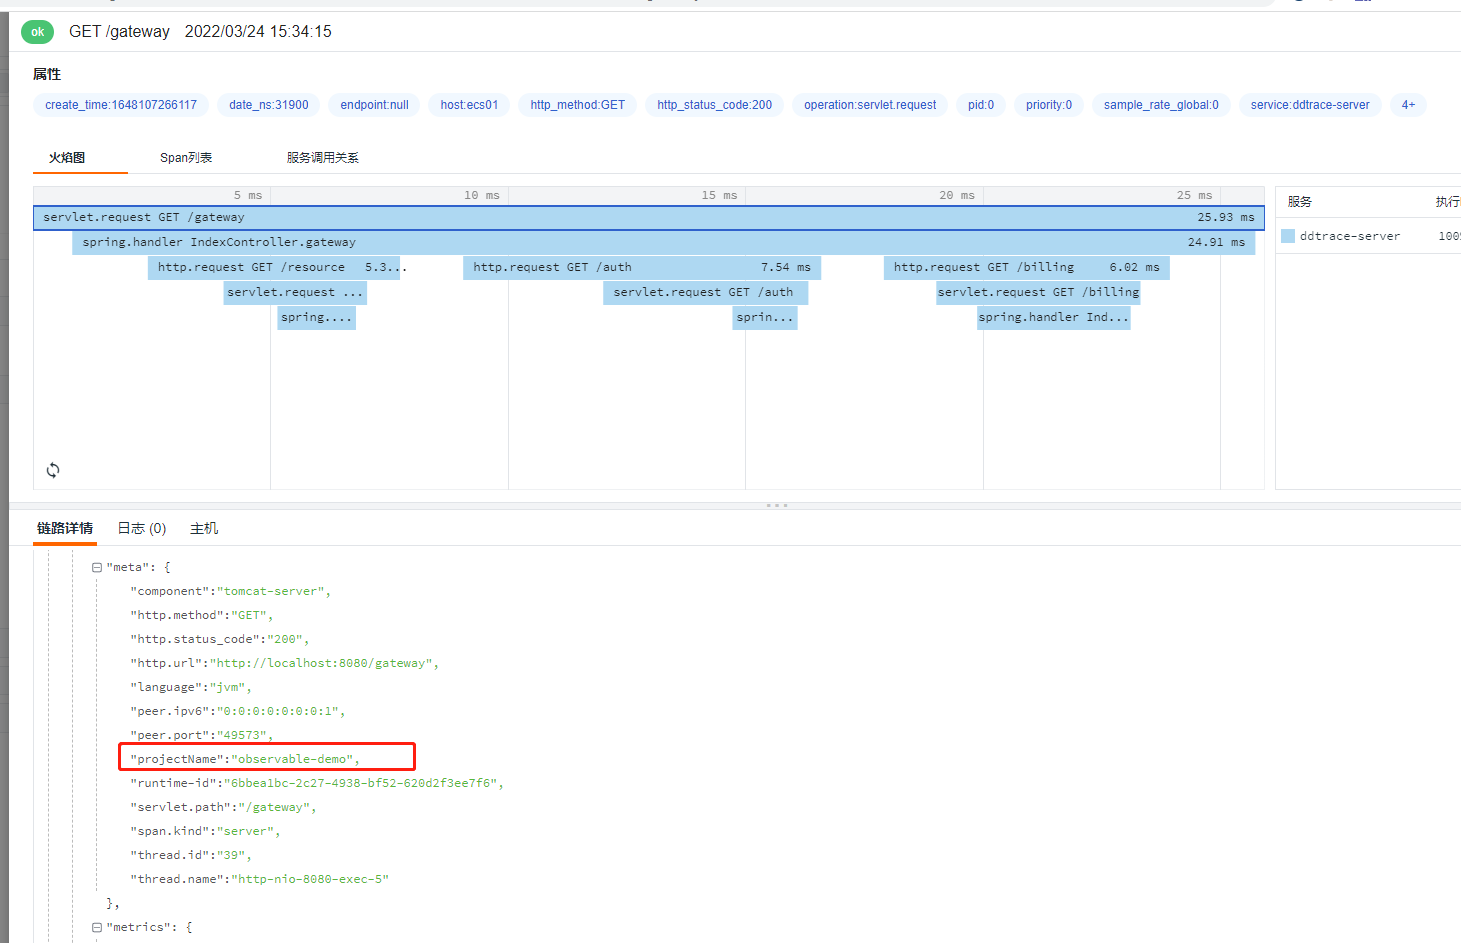
将 projectName:observable-demo 添加到每个 span 的示例:
-Ddd.trace.span.tags=projectName:observable-demo
dd.tags
-Ddd.tags=user_name:joy
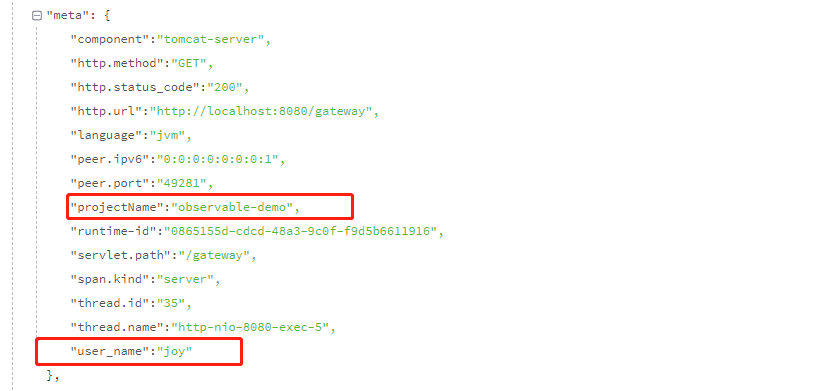
两种方式都能生成 tag,效果一样,都会在meta里面展示数据。
如果确实想要把 dd.tags标记的 tag 作为观测云的 标签 ,则需要在 ddtrace.conf 配置 customer_tags
[[inputs.ddtrace]]endpoints = ["/v0.3/traces", "/v0.4/traces", "/v0.5/traces"]customer_tags = ["projectName","user_name"]
效果如图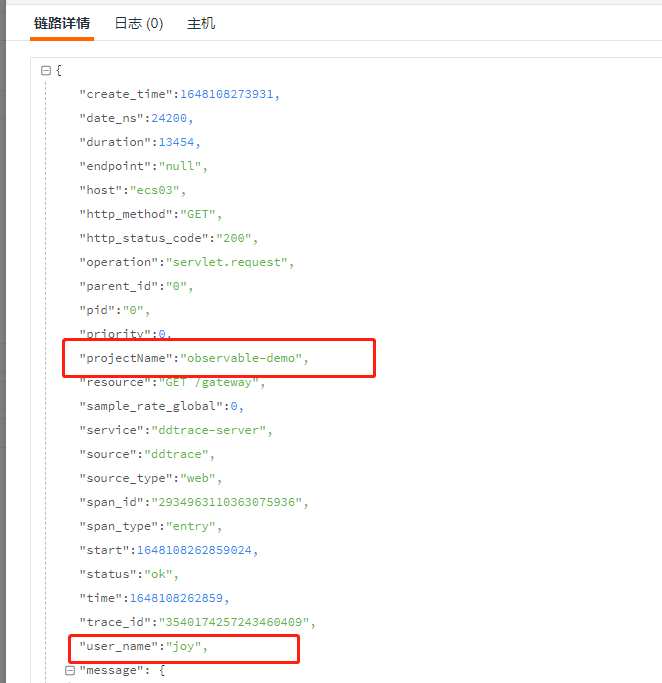
注意:如果自定义tag 包含了 tag 关键字,则会当成标签显示。
显示数据库实例名称
显示数据库的名称,默认显示数据库的类型,如需要显示数据库名称,将值设置成TRUE
-Ddd.trace.db.client.split-by-instance=TRUE
以上 demo 并没有加载数据库,所以想要达到这个效果,可以选择一个引入数据库的应用添加参数 dd.trace.db.client.split-by-instance=TRUE
效果图: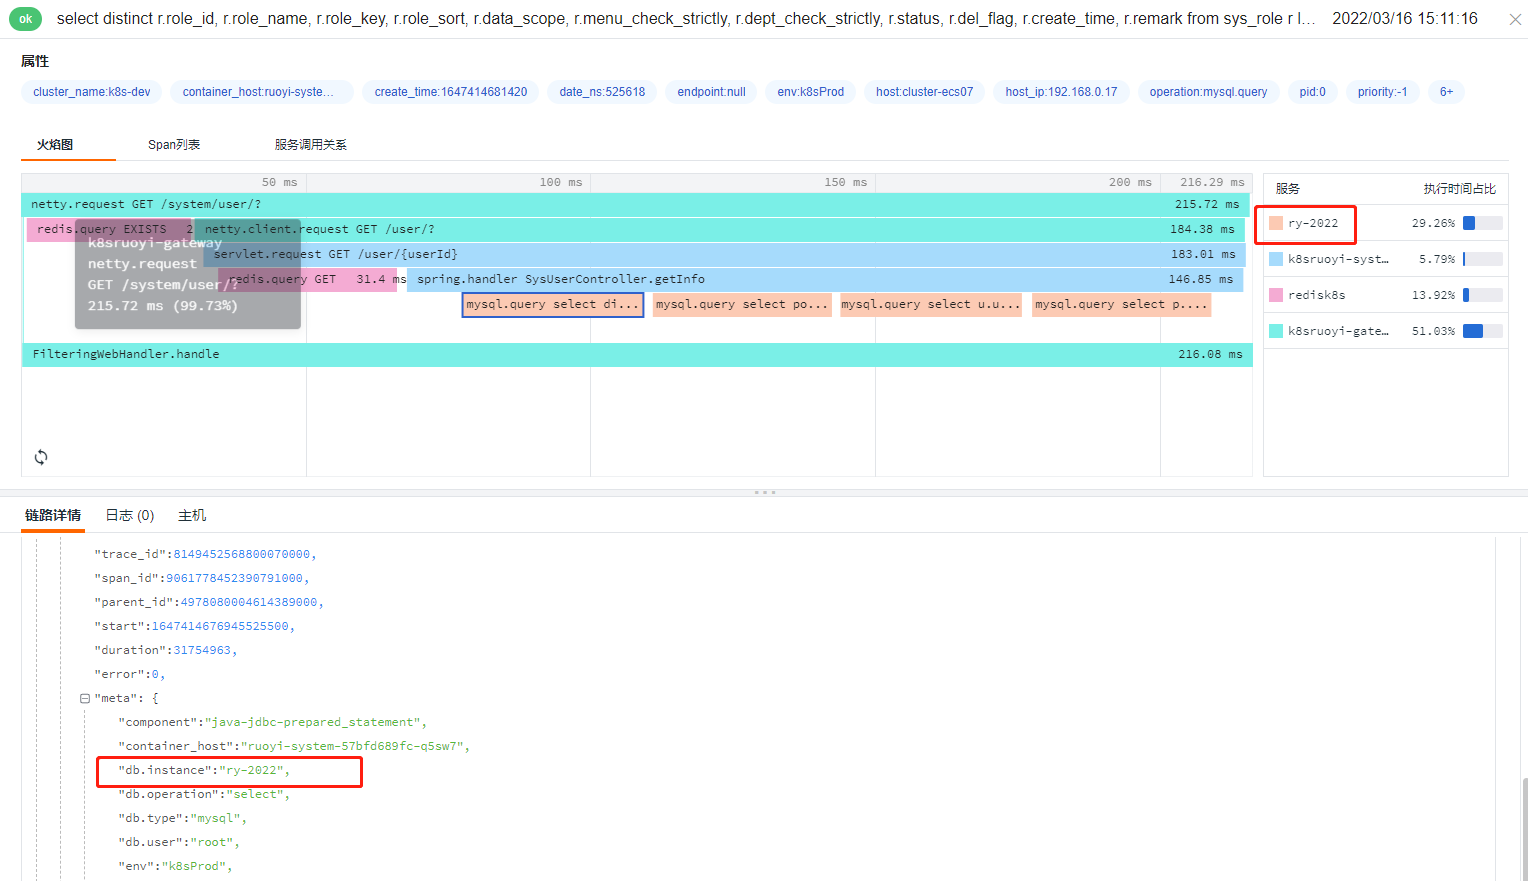
采样
ddtrace.conf 采样部分配置
## Sampler config uses to set global sampling strategy.## priority uses to set tracing data propagation level, the valid values are -1, 0, 1## -1: always reject any tracing data send to datakit## 0: accept tracing data and calculate with sampling_rate## 1: always send to data center and do not consider sampling_rate## sampling_rate used to set global sampling rate[inputs.ddtrace.sampler]priority = 0sampling_rate = 0.1
测试脚本
for ((i=1;i<=100;i++));docurl http://localhost:8080/counterdone
priority = 0
sampling_rate范围 (0,1),不在范围内,trace丢弃。如果需要全采,则不需要配置[inputs.ddtrace.sampler]
应用不配置dd.trace.sample.rate
sampling_rate = 0.1
| 请求序号 | 次数 | 观测云traceId数 |
|---|---|---|
| 1 | 100 | 7 |
| 2 | 100 | 12 |
| 3 | 1000 | 101 |
-Ddd.trace.sample.rate=0.10 & sampling_rate = 0.1
| 请求序号 | 次数 | 观测云traceId数 |
|---|---|---|
| 1 | 1000 | 103 |
| 2 | 1000 | 104 |
| 3 | 2000 | 204 |
| 4 | 2000 | 203 |
-Ddd.trace.sample.rate=0.10 对结果不影响,可以删除。
sampling_rate = 0.5
| 请求序号 | 次数 | 观测云traceId数 |
|---|---|---|
| 1 | 1000 | 505 |
| 2 | 1000 | 505 |
| 3 | 2000 | 998 |
| 4 | 2000 | 1006 |
datakit sampling_rate = 1
| 请求序号 | 次数 | 观测云traceId数 |
|---|---|---|
| 1 | 500 | 0 |
| 2 | 500 | 0 |
priority =1
sampling_rate参数失效,应用层面如果不配置概率采样,则datakit会过滤所有的trace
应用配置概率 -Ddd.trace.sample.rate=0.10
| 请求序号 | 次数 | 观测云traceId数 |
|---|---|---|
| 1 | 100 | 100 |
| 2 | 500 | 500 |
应用配置概率 -Ddd.trace.sample.rate=1
| 请求序号 | 次数 | 观测云traceId数 |
|---|---|---|
| 1 | 100 | 100 |
| 2 | 500 | 500 |
应用配置概率 -Ddd.trace.sample.rate=10
| 请求序号 | 次数 | 观测云traceId数 |
|---|---|---|
| 1 | 100 | 100 |
| 2 | 500 | 500 |
应用配置概率 -Ddd.trace.sample.rate=0.5
| 请求序号 | 次数 | 观测云traceId数 |
|---|---|---|
| 1 | 100 | 100 |
| 2 | 100 | 100 |
priority =-1
无论其他参数怎么配置,都不会上报trace信息。
采样结论
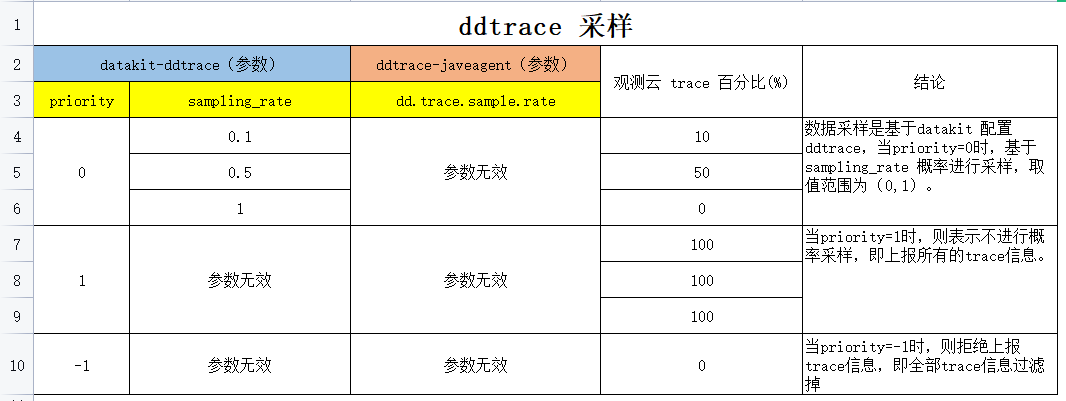
数据采样是基于datakit 配置ddtrace来进行采样的
- 当priority=0时,基于sampling_rate 概率进行采样,取值范围为(0,1)。
- 当priority=1时,则表示不进行概率采样,即上报所有的trace信息。
- 当priority=-1时,则拒绝上报trace信息,即全部trace信息过滤掉。
同时也证明了 ddtrace-javagent 采样参数无效。
过滤 Resource
即过滤一些不需要的请求,减少trace的上报。比如过滤 nacos 数据中心相关的资源上报、eureka 数据中心相关的资源上报。
主要是通过datakit 的 inputs.ddtrace.close_resource标签配置进行过滤
## Ignore tracing resources map like service:[resources...].## The service name is the full service name in current application.## The resource list is regular expressions uses to block resource names.## If you want to block some resources universally under all services, you can set the## service name as "*". Note: double quotes "" cannot be omitted.# [inputs.ddtrace.close_resource]# service1 = ["resource1", "resource2", ...]# service2 = ["resource1", "resource2", ...]# "*" = ["close_resource_under_all_services"]# ...
比如过滤 resource 为 counter的请求。
[inputs.ddtrace.close_resource]ddtrace-server = ["counter"]
如果要过滤所有的 service counter请求,可以用通配符"*"代替 servicename,如:
[inputs.ddtrace.close_resource]"*" = ["counter"]
如果要过滤的 resource 存在多层级span链路,不会对当前链路上报有影响,只会影响被过滤的resource不能上报上来。如,过滤 gateway
[inputs.ddtrace.close_resource]"*" = ["gateway"]
通过请求curl http://localhost:8080/gateway,在观测云上查看链路情况,发现 resource为 gateway的请求已经过滤掉了。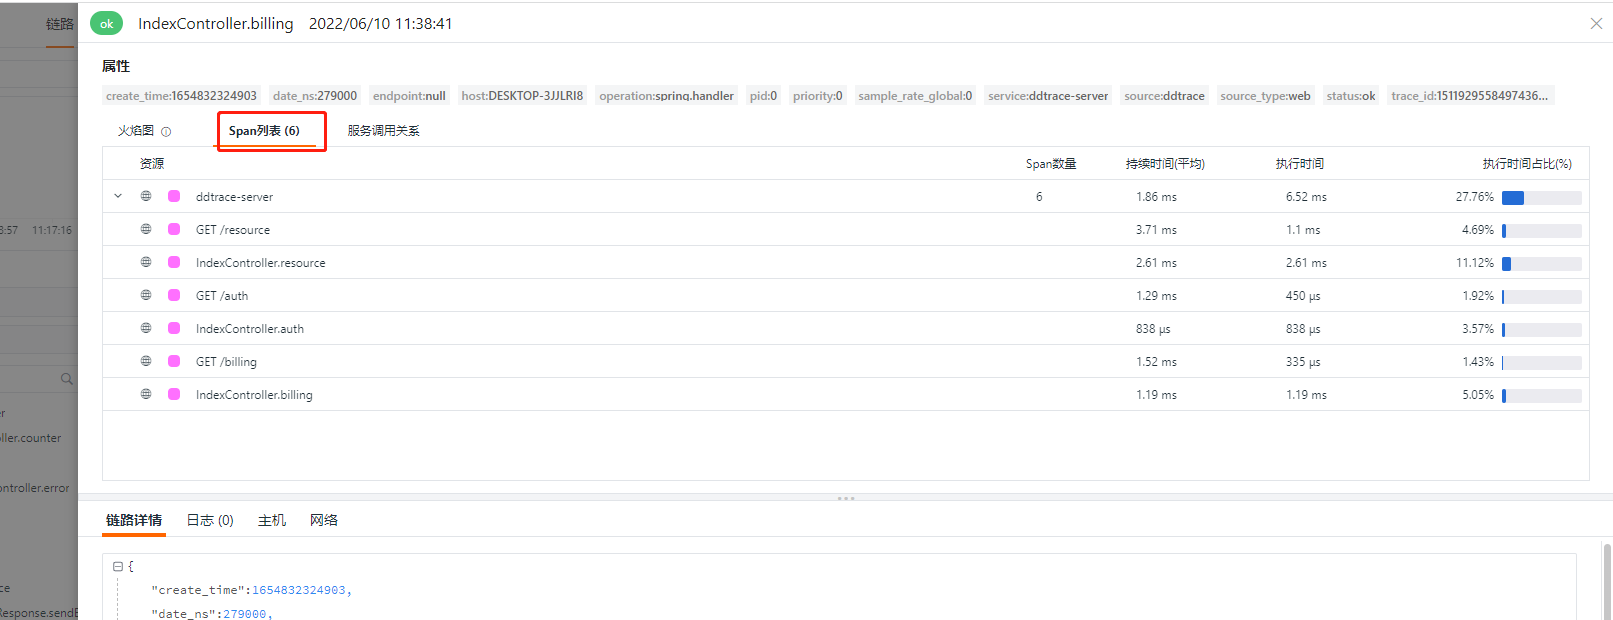
入侵式埋点
与前面件Tag有差异,前面是通过 javaagent方式配置埋点,相对来说方便管理和动态埋点,不会因为想要对特殊的请求做一些埋点而调整代码。但同时配置会比较繁琐,入侵式埋点能够很好的跟业务结合,对业务进行埋点,则需要用 dd-trace-api的方式。
以java为例
<dependency><groupId>com.datadoghq</groupId><artifactId>dd-trace-api</artifactId><version>0.102.0</version></dependency>
在对应需要埋点的方法添加注解 @Trace
@Tracepublic String apiTrace(){return "apiTrace";}
然后在 gateway方法调用这个
...testService.apiTrace();...
重启,访问 gateway
注意:入侵式埋点不代表应用启动的时候不需要 agent ,如果没有agent, @Trace 也将失效。@Trace 注释具有默认操作名称 trace.annotation,而跟踪的方法默认具有资源。
可以修改对应的名称
@Trace(resourceName = "apiTrace",operationName = "apiTrace")public String apiTrace(){return "apiTrace";}
修改后,效果如下: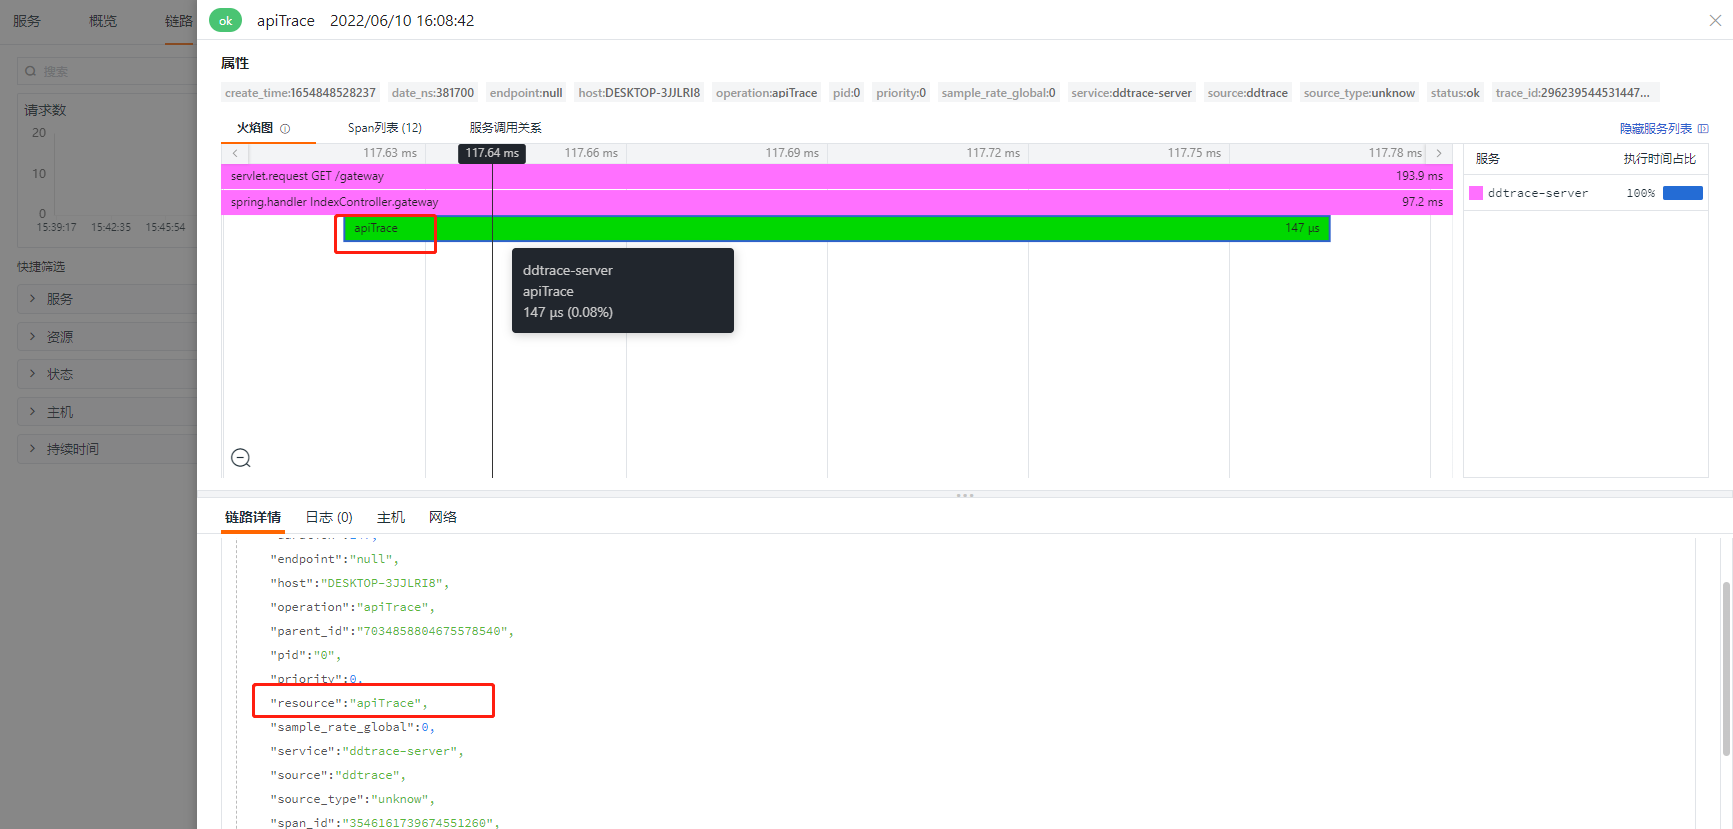
Log
trace与 log 关联,都是通过 MDC 方式进行埋点。以logback-spring.xml为例
logback-spring.xml
<?xml version="1.0" encoding="UTF-8"?><configuration scan="true" scanPeriod="30 seconds"><!-- 部分参数需要来源于properties文件 --><springProperty scope="context" name="logName" source="spring.application.name" defaultValue="localhost.log"/><!-- 配置后可以动态修改日志级别--><jmxConfigurator /><property name="log.pattern" value="%d{yyyy-MM-dd HH:mm:ss.SSS} [%thread] %-5level %logger{20} - [%method,%line] %X{dd.service} %X{dd.trace_id} %X{dd.span_id} - %msg%n" /><!-- %m输出的信息,%p日志级别,%t线程名,%d日期,%c类的全名,,,, --><appender name="STDOUT" class="ch.qos.logback.core.ConsoleAppender"><encoder><pattern>${log.pattern}</pattern><charset>UTF-8</charset></encoder></appender><appender name="FILE" class="ch.qos.logback.core.rolling.RollingFileAppender"><file>logs/${logName}/${logName}.log</file> <!-- 使用方法 --><append>true</append><rollingPolicy class="ch.qos.logback.core.rolling.SizeAndTimeBasedRollingPolicy"><fileNamePattern>logs/${logName}/${logName}-%d{yyyy-MM-dd}.log.%i</fileNamePattern><maxFileSize>64MB</maxFileSize><maxHistory>30</maxHistory><totalSizeCap>1GB</totalSizeCap></rollingPolicy><encoder><pattern>${log.pattern}</pattern><charset>UTF-8</charset></encoder></appender><!-- 只打印error级别的内容 --><logger name="com.netflix" level="ERROR" /><logger name="net.sf.json" level="ERROR" /><logger name="org.springframework" level="ERROR" /><logger name="springfox" level="ERROR" /><!-- sql 打印 配置--><logger name="com.github.pagehelper.mapper" level="DEBUG" /><logger name="org.apache.ibatis" level="DEBUG" /><root level="info"><appender-ref ref="STDOUT" /><appender-ref ref="FILE" /></root></configuration>
主要是通过 pattern 配置日志格式,%d{yyyy-MM-dd HH:mm:ss.SSS} [%thread] %-5level %logger{20} - [%method,%line] %X{dd.service} %X{dd.trace_id} %X{dd.span_id} - %msg%n
2022-06-10 17:07:45.257 [main] INFO o.a.c.c.StandardEngine - [log,173] ddtrace-server - Starting Servlet engine: [Apache Tomcat/9.0.56]2022-06-10 17:07:45.369 [main] INFO o.a.c.c.C.[.[.[/] - [log,173] ddtrace-server - Initializing Spring embedded WebApplicationContext2022-06-10 17:07:45.758 [main] INFO o.a.c.h.Http11NioProtocol - [log,173] ddtrace-server - Starting ProtocolHandler ["http-nio-8080"]2022-06-10 17:07:45.786 [main] INFO c.z.o.d.DdtraceApplication - [logStarted,61] ddtrace-server - Started DdtraceApplication in 2.268 seconds (JVM running for 5.472)2022-06-10 17:09:01.493 [http-nio-8080-exec-1] INFO o.a.c.c.C.[.[.[/] - [log,173] ddtrace-server 5983174698688502665 5075189911231446778 - Initializing Spring DispatcherServlet 'dispatcherServlet'2022-06-10 17:09:01.550 [http-nio-8080-exec-1] INFO c.z.o.d.c.IndexController - [gateway,48] ddtrace-server 5983174698688502665 7355870844984555943 - this is tag2022-06-10 17:09:01.625 [http-nio-8080-exec-3] INFO c.z.o.d.c.IndexController - [auth,69] ddtrace-server 5983174698688502665 7209299453959523135 - this is auth2022-06-10 17:09:01.631 [http-nio-8080-exec-4] INFO c.z.o.d.c.IndexController - [billing,77] ddtrace-server 5983174698688502665 9179949003735674110 - this is method3,null
datakit 采集日志
上述日志输出到文本后,datakit 可以从文本文件里面读取日志信息并上报到观测云。
开启日志采集器
# {"version": "1.2.18", "desc": "do NOT edit this line"}[[inputs.logging]]## requiredlogfiles = ["D:/code_zy/observable-demo/logs/ddtrace-server/*.log",]# only two protocols are supported:TCP and UDP# sockets = [# "tcp://0.0.0.0:9530",# "udp://0.0.0.0:9531",# ]## glob filteerignore = [""]## your logging source, if it's empty, use 'default'source = "ddtrace-server"## add service tag, if it's empty, use $source.service = "ddtrace-server"## grok pipeline script namepipeline = "log-ddtrace.p"## optional status:## "emerg","alert","critical","error","warning","info","debug","OK"ignore_status = []## optional encodings:## "utf-8", "utf-16le", "utf-16le", "gbk", "gb18030" or ""character_encoding = ""## datakit read text from Files or Socket , default max_textline is 32k## If your log text line exceeds 32Kb, please configure the length of your text,## but the maximum length cannot exceed 32Mb# maximum_length = 32766## The pattern should be a regexp. Note the use of '''this regexp'''## regexp link: https://golang.org/pkg/regexp/syntax/#hdr-Syntax# multiline_match = '''^\S'''## removes ANSI escape codes from text stringsremove_ansi_escape_codes = false## if file is inactive, it is ignored## time units are "ms", "s", "m", "h"ignore_dead_log = "10m"[inputs.logging.tags]# some_tag = "some_value"# more_tag = "some_other_value"
配置 pipeline
目的是为了将日志进行切割,将一些关键的字段作为tag,用于过滤、筛选和数据分析。
#日志样式#2022-06-10 17:09:01.625 [http-nio-8080-exec-3] INFO c.z.o.d.c.IndexController - [auth,69] ddtrace-server 5983174698688502665 7209299453959523135 - this is authgrok(_, "%{TIMESTAMP_ISO8601:time} %{NOTSPACE:thread_name} %{LOGLEVEL:status}%{SPACE}%{NOTSPACE:class_name} - \\[%{NOTSPACE:method_name},%{NUMBER:line}\\] %{DATA:service_name} %{DATA:trace_id} %{DATA:span_id} - %{GREEDYDATA:msg}")default_time(time,"Asia/Shanghai")
切割后的日志,已经产生了很多tag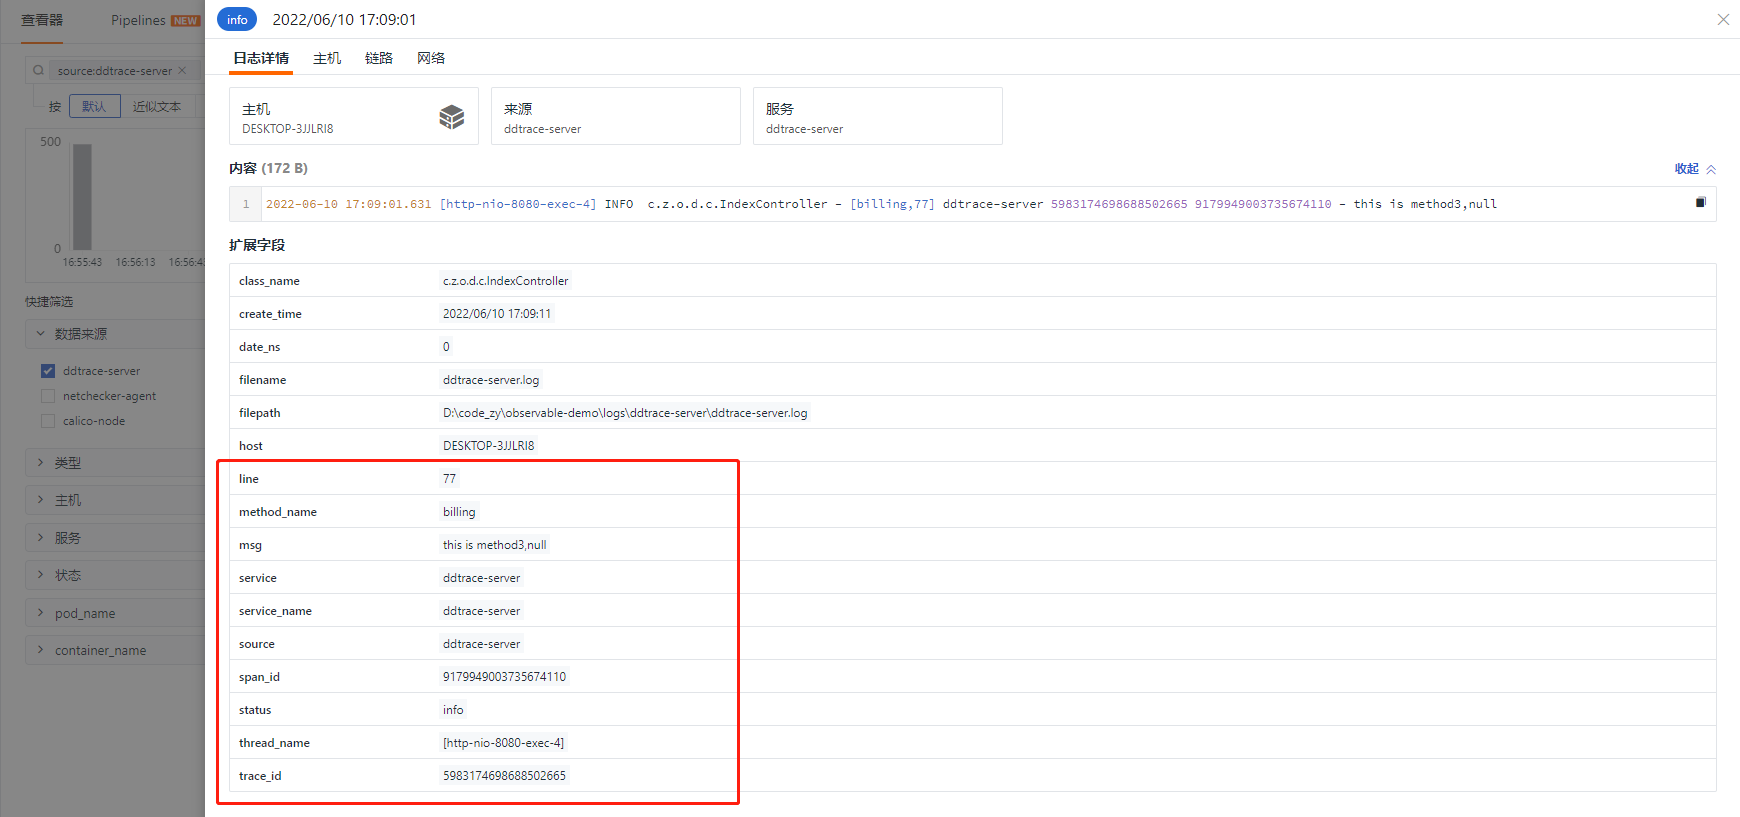
观测云也支持其他的日志方式采集,比如socket,更多日志采集参考:https://www.yuque.com/dataflux/bp/logging
当我们从日志里面把 traceId 和 spanId 切出来后,观测云上可以直接从日志关联到对应的链路信息,实现了日志链路的互通行为。
demo 源码地址 https://github.com/lrwh/observable-demo/tree/main/springboot-ddtrace-server

若有收获,就点个赞吧
0 人点赞
