环境:phpstorm + phpstudy +xdebug + 火狐
phpstudy自带xdebug
其他选项菜单 —> PHP扩展及设置 —> PHP扩展 —> Xdebug
设置php.ini(一定要是你php运行版本环境下的php.ini), 设置完毕务必重启服务
[XDebug]xdebug.profiler_append = 0;效能监测的设置开关xdebug.profiler_enable = 1xdebug.profiler_enable_trigger = 0;profiler_enable设置为1的时候,效能监测信息写入文件所在的目录xdebug.profiler_output_dir="D:\phpStudy\tmp";设置的函数调用监测信息的输出路径xdebug.trace_output_dir="D:\phpStudy\tmp";生成的效能监测文件的名字xdebug.profiler_output_name ="cache.out.%t-%s";IDE与XDebug协作,端口设置不要冲突其他服务xdebug.remote_enable = onxdebug.remote_handler = "dbgp"xdebug.remote_host = "127.0.0.1"xdebug.remote_port = 9010xdebug.idekey = phpstorm;远程断点自动打开xdebug.remote_autostart = on;.dll文件的路径,ext文件下自带xdebug的dll文件zend_extension="E:\PhpStudy\PHPTutorial\php\php-7.1.13-nts\ext\php_xdebug.dll"
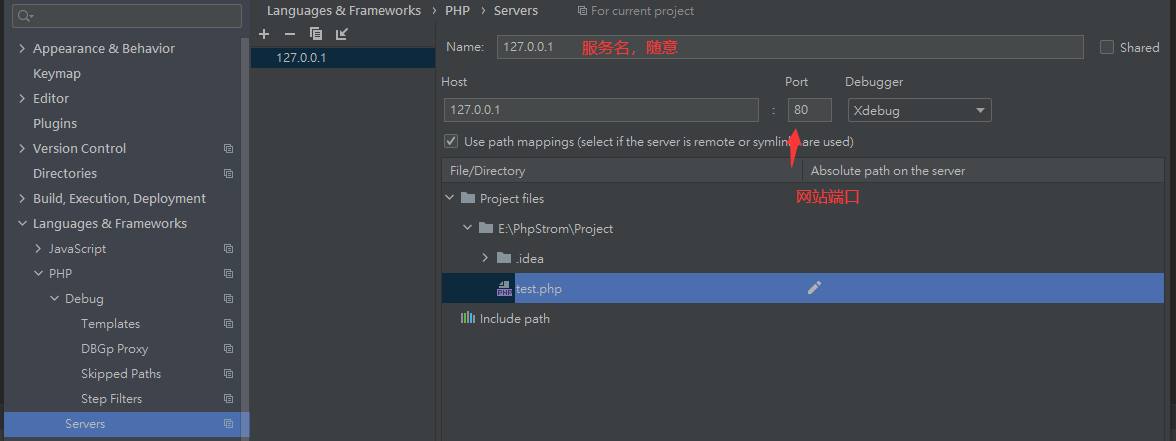
phpstorm设置
File —> Settings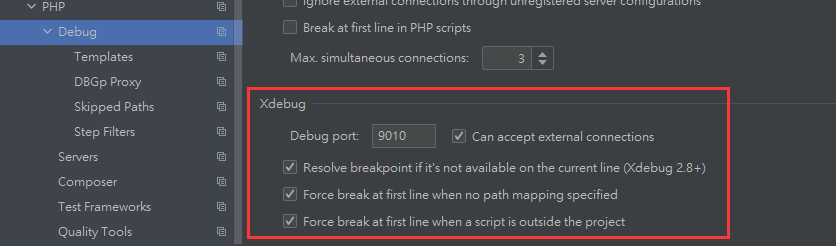
设置PHP环境(要与运行调试版本一直)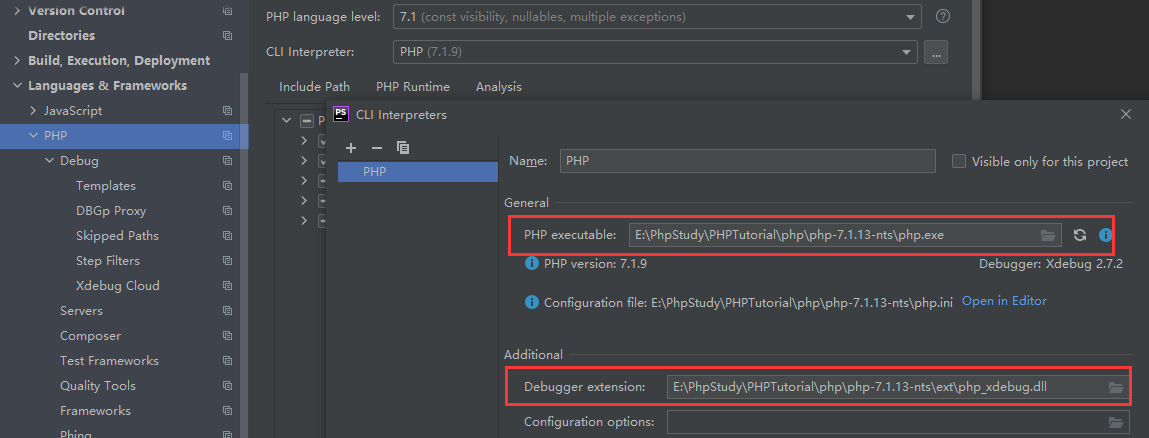
IDE key 设置要与php.ini 的xdebug.idekey一致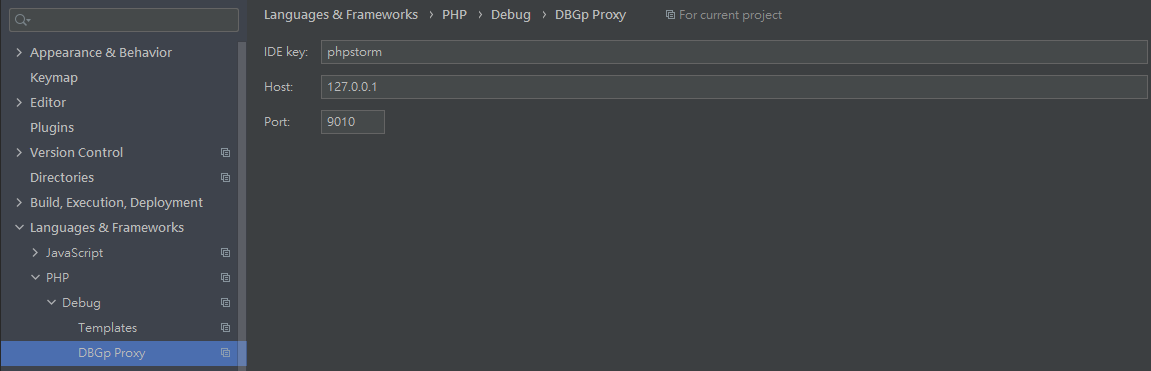
phpinfo 页面会出现xdebug版本与IDE key,表示成功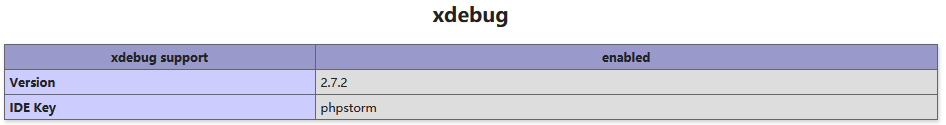
火狐浏览器安装插件

若有收获,就点个赞吧
0 人点赞
