写在前面:
自己已经创建公众号啦~
AI算法交流+开源数据汇总+私房数据及标注数据共享+自己实践项目开源
欢迎大家关注:DeepAI 视界

展示一下:

爬虫:链接网二手房(以贵阳市为例)
"""爬虫"""import requestsfrom lxml import etreeimport xlwtimport xlrdimport csvimport pandas as pdimport timeimport reclass LanjiaSpider:def __init__(self):self.url = 'https://wh.lianjia.com/ershoufang/ronganxian/pg{}/'self.headers = {"User-Agent": "Mozilla/5.0 (Windows NT 10.0; WOW64) AppleWebKit/537.36 (KHTML, like Gecko) Chrome/75.0.3770.100 Safari/537.36"}def get_response_spider(self, url_str): # 发送请求get_response = requests.get(url_str, headers=self.headers)time.sleep(2)response = get_response.content.decode()html = etree.HTML(response)return htmldef get_content_html(self, html): # 使xpath获取数据self.houseInfo = html.xpath('//div[@class="houseInfo"]/text()')self.title = html.xpath('//div[@class="title"]/a/text()')self.positionInfo = html.xpath('//div[@class="positionInfo"]/a/text()')self.totalPrice = html.xpath('//div[@class="totalPrice"]/span/text()')self.unitPrice = html.xpath('//div[@class="unitPrice"]/span/text()')self.followInfo = html.xpath('//div[@class="followInfo"]/text()')self.tag = html.xpath('//div[@class="tag"]/span/text()')# print(title)# return houseInfo,title,positionInfo,totalPrice,unitPrice,followInfo,tagdef xpath_houseInfo(self):#print(self.houseInfo)#print(type(self.houseInfo))# df = pd.DataFrame({"houseInfo": self.houseInfo,"tite":self.title,"positionInfo":self.positionInfo,"totaPrice":self.totalPrice,"unitPrice":self.unitPrice,"followInfo":self.followInfo,"tag":self.tag})# df=pd.DataFrame({"houseInfo": self.houseInfo,"tite":self.title})# df.to_excel(r'C:\Users\wy\Desktop\sublime\链家\pand3.xlsx')# a=len(self.houseInfo)for i in range(len(self.houseInfo)):# print(i)# yield i# print(type(self.houseInfo))yield self.houseInfo[i]def qingxi_data_houseInfo(self): # 清洗数据self.xpath_houseInfo()self.xpath_title()self.xpath_positionInfo()self.xpath_totalPrice()self.xpath_unitPrice()self.xpath_followInfo()self.xpath_tag()get_houseInfo = self.xpath_houseInfo()get_title = self.xpath_title()get_positionInfo=self.xpath_positionInfo()get_totalPrice = self.xpath_totalPrice()get_unitPrice = self.xpath_unitPrice()get_followInfo=self.xpath_followInfo()get_tag=self.xpath_tag()i = 1while True:data_houseInfo= next(get_houseInfo)data_title=next(get_title)data_positionInfo=next(get_positionInfo)data_totalPrice=next(get_totalPrice)data_unitPrice=next(get_unitPrice)data_followInfo=next(get_followInfo)data_tag=next(get_tag)with open("a.csv", "a", newline="", encoding="utf-8-sig") as f:# fieldnames = ['houseInfo', 'title', 'positionInfo', 'totalPrice/万元', 'unitPrice', 'followInfo', 'tag']# writer = csv.DictWriter(f, fieldnames=fieldnames) # 写入表头# writer.writeheader()writer = csv.DictWriter(f, fieldnames=fieldnames) # 写入表头list_1 = ['houseInfo', 'title', 'positionInfo', 'totalPrice/万元', 'unitPrice', 'followInfo', 'tag']list_2 = [data_houseInfo,data_title,data_positionInfo,data_totalPrice,data_unitPrice,data_followInfo,data_tag]list_3 = dict(zip(list_1, list_2))writer.writerow(list_3)print("写入第"+str(i)+"行数据")i += 1if i > len(self.houseInfo):breakdef xpath_title(self):for i in range(len(self.title)):yield self.title[i]def xpath_positionInfo(self):for i in range(len(self.positionInfo)):yield self.positionInfo[i]def xpath_totalPrice(self):for i in range(len(self.totalPrice)):yield self.totalPrice[i]def xpath_unitPrice(self):for i in range(len(self.unitPrice)):yield self.unitPrice[i]def xpath_followInfo(self):for i in range(len(self.followInfo)):yield self.followInfo[i]def xpath_tag(self):for i in range(len(self.tag)):yield self.tag[i]def run(self):i = 1while True:url_str = self.url.format(i) # 构造请求urlhtml = self.get_response_spider(url_str)self.get_content_html(html)self.qingxi_data_houseInfo()i += 1if i == 1: # 不包括57页breakif __name__ == "__main__":with open("a.csv", "a", newline="", encoding="utf-8-sig") as f:fieldnames = ['houseInfo', 'title', 'positionInfo', 'totalPrice/万元', 'unitPrice', 'followInfo', 'tag']writer = csv.DictWriter(f, fieldnames=fieldnames) # 写入表头writer.writeheader()lanjia = LanjiaSpider()lanjia.run()
对应的数据可视化:
"""数据分析及可视化"""import pandas as pdfrom pyecharts.charts import Line, Barimport numpy as npfrom pyecharts.globals import ThemeTypefrom pyecharts.charts import Piefrom pyecharts import options as optsplaces = ['lianjia_BaiYunQu', 'lianjia_GuanShanHuQu', 'lianjia_HuaXiQu', 'lianjia_NanMingQu', 'lianjia_WuDangQu', 'lianjia_YunYanQu']place = ['白云区', '观山湖区', '花溪区', '南明区', '乌当区', '云岩区']avgs = [] # 房价均值median = [] # 房价中位数favourate_avg = [] # 房价收藏人数均值favourate_median = [] # 房价收藏人数中位数houseidfo = ['2室1厅', '3室1厅', '2室2厅', '3室2厅', '其他'] # 房型定义houseidfos = ['2.1', '3.1', '2.2', '3.2']sum_house = [0, 0, 0, 0, 0] # 各房型数量price = [] # 房价fav = [] # 收藏人数type = []area = [] # 房间面积def avg(name):df = pd.read_csv(str(name)+'.csv', encoding='utf-8')pattern = '\d+'df['totalPrice/万元'] = df['totalPrice/万元'].str.findall(pattern)df['followInfo'] = df['followInfo'].str.findall(pattern)df['houseInfo'] = df['houseInfo'].str.findall(pattern)sum_houses = [0, 0, 0, 0, 0]# print(sum_house)avg_work_year = []medians = []favourates = []k = 0k1 = 0k3 = 0k4 = 0for i in range(len(df)):if (i + 1) % 2 == 0:continueelse:if len(df['totalPrice/万元'][i]) == 2:avg_work_year.append(','.join(df['totalPrice/万元'][i]).replace(',', '.'))medians.append(float(','.join(df['totalPrice/万元'][i]).replace(',', '.')))price.append(','.join(df['totalPrice/万元'][i]).replace(',', '.'))if len(df['followInfo'][i]) ==2:favourates.append(int(','.join(df['followInfo'][i][:1])))fav.append(int(','.join(df['followInfo'][i][:1])))if float(','.join(df['houseInfo'][i][:2]).replace(',', '.')) == 2.1:k +=1sum_houses[0] =ktype.append(2.1)if float(','.join(df['houseInfo'][i][:2]).replace(',', '.')) == 3.1:k1 +=1sum_houses[1] =k1type.append(3.1)if float(','.join(df['houseInfo'][i][:2]).replace(',', '.')) == 2.2:k3 +=1sum_houses[2] =k3type.append(2.2)if float(','.join(df['houseInfo'][i][:2]).replace(',', '.')) == 3.2:k4 +=1sum_houses[3] =k4type.append(3.2)else:k4 +=1sum_houses[4] = k4type.append('other')area.append(float(','.join(df['houseInfo'][i][2:4]).replace(',', '.')))sum_house[0] =sum_houses[0]sum_house[1] = sum_houses[1]sum_house[2] = sum_houses[2]sum_house[3] = sum_houses[3]sum_house[4] = sum_houses[4]favourates.sort()favourate_median.append(int(np.median(favourates)))medians.sort()median.append(np.median(medians))# price = avg_work_yearb = len(avg_work_year)b1= len(favourates)sum = 0sum1 = 0for i in avg_work_year:sum = sum+float(i)avgs.append(round(sum/b, 2))for i in favourates:sum1 = sum1+float(i)favourate_avg.append(round(int(sum1/b1), 2))for i in places:avg(i)print("各区平均房价", avgs)print('各房型的出售总数:', sum_house)print("房间面积", area)"""[280, 56, 504, 1676, 1680][392, 112, 448, 1679, 1680][224, 0, 616, 3359, 3360][448, 112, 280, 1679, 1680][504, 0, 336, 1680, 1679][224, 56, 168, 1680, 1670][66.17, 65.6, 76.04, 78.94, 62.06, 74.37][68.8, 67.8, 79.8, 70.8, 57.6, 78.8][6, 6, 9, 4, 4, 4] [5, 4, 3, 2, 3, 2]"""# print(median)# print(favourate_avg,favourate_median)line = Line()line.add_xaxis(place)line.add_yaxis("贵阳各地房价平均值(万元)", avgs)line.add_yaxis("贵阳各地房价中位数值(万元)", median)# line.render("predict_line.html")def bar() -> Bar:c = (Bar({"theme": ThemeType.MACARONS}).add_xaxis(place).add_yaxis("平均值", avgs).add_yaxis("中位数", median).set_global_opts(title_opts={"text": "贵阳各地房价(万元)"}))return cbar().render("predict_bar.html")# print(sum_house)def bar() -> Bar:c = (Bar({"theme": ThemeType.MACARONS}).add_xaxis(houseidfo).add_yaxis(place[0], [280, 56, 504, 1676, 1680]).add_yaxis(place[1], [392, 112, 448, 1679, 1680]).add_yaxis(place[2], [224, 0, 616, 3359, 3360]).add_yaxis(place[3], [448, 112, 280, 1679, 1680]).add_yaxis(place[4], [504, 0, 336, 1680, 1679]).add_yaxis(place[-1], sum_house)# .add_yaxis("中位数", favourate_median).set_global_opts(title_opts={"text": "贵阳各地房型\n数量"}))return c# bar().render("house_bar.html")line = Line()line.add_xaxis(place)line.add_yaxis("贵阳各地房子平均面积\n(平米)", area)line.render("Area_line.html")list_num = favourate_avgattr = place# print(zip(attr, list_num))s = [list(z) for z in zip(attr, list_num)]c = (Pie().add("", s).set_global_opts(title_opts=opts.TitleOpts(title="贵阳市各区楼房\n平均收藏人数")).set_series_opts(label_opts=opts.LabelOpts(formatter="{b}: {c}")))c.render("pie_avg.html")list_num = favourate_medianattr = place# print(zip(attr, list_num))s = [list(z) for z in zip(attr, list_num)]c = (Pie().add("", s).set_global_opts(title_opts=opts.TitleOpts(title="贵阳市各区楼房\n收藏人数中位数")).set_series_opts(label_opts=opts.LabelOpts(formatter="{b}: {c}")))c.render("pie_median.html")from pyecharts import options as optsfrom pyecharts.charts import Scatter3Dfrom pyecharts.faker import Fakerprice=[float(i)/1 for i in price]# print(price)# types=list(map(mapfunc,df.house_type.values))# type = [224, 56, 168, 1680, 1670]data = []# print(fav,type)# for j in range(len(type)):# for k in range(len(fav)):for j in range(100):for k in range(100):for i in range(500):try:data.append([type[j], favourate_avg[k],price[i]])except:continue# print(data)scatter = (Scatter3D(init_opts=opts.InitOpts(width='900px', height='600px')) # 初始化.add("", data,grid3d_opts=opts.Grid3DOpts(width=300, depth=300, rotate_speed=300, is_rotate=True,),)# 设置全局配置项.set_global_opts(title_opts=opts.TitleOpts(title="房型——关注度——价格\n三维关系图"), # 添加标题visualmap_opts=opts.VisualMapOpts(max_=100, # 最大值pos_top=200, # visualMap 组件离容器上侧的距离range_color=Faker.visual_color # 颜色映射))# .render("3D散点图.html"))print('数据分析和可视化结束,左边点开~')
同时赠送给大家另一个版本的:
爬虫:链家网:柳州市
# -*- coding: utf-8 -*-import scrapyimport requestsfrom lxml import etreeimport xlwtimport xlrdimport csvimport pandas as pdimport timeclass LanjiaSpider:def __init__(self):self.url = 'https://liuzhou.lianjia.com/ershoufang/yufengqu/pg{}/'self.headers = {"User-Agent": "Mozilla/5.0 (Windows NT 10.0; WOW64) AppleWebKit/537.36 (KHTML, like Gecko) Chrome/75.0.3770.100 Safari/537.36"}def get_response_spider(self, url_str): # 发送请求get_response = requests.get(self.url, headers=self.headers)time.sleep(2)response = get_response.content.decode()html = etree.HTML(response)return htmldef get_content_html(self, html): # 使xpath获取数据self.houseInfo = html.xpath('//div[@class="houseInfo"]/text()')self.title = html.xpath('//div[@class="title"]/a/text()')self.positionInfo = html.xpath('//div[@class="positionInfo"]/a/text()')self.totalPrice = html.xpath('//div[@class="totalPrice"]/span/text()')self.unitPrice = html.xpath('//div[@class="unitPrice"]/span/text()')self.followInfo = html.xpath('//div[@class="followInfo"]/text()')self.tag = html.xpath('//div[@class="tag"]/span/text()')# print(title)# return houseInfo,title,positionInfo,totalPrice,unitPrice,followInfo,tagdef xpath_houseInfo(self):#print(self.houseInfo)#print(type(self.houseInfo))# df = pd.DataFrame({"houseInfo": self.houseInfo,"tite":self.title,"positionInfo":self.positionInfo,"totaPrice":self.totalPrice,"unitPrice":self.unitPrice,"followInfo":self.followInfo,"tag":self.tag})# df=pd.DataFrame({"houseInfo": self.houseInfo,"tite":self.title})# df.to_excel(r'C:\Users\wy\Desktop\sublime\链家\pand3.xlsx')# a=len(self.houseInfo)for i in range(len(self.houseInfo)):# print(i)# yield i# print(type(self.houseInfo))yield self.houseInfo[i]def qingxi_data_houseInfo(self): # 清洗数据self.xpath_houseInfo()self.xpath_title()self.xpath_positionInfo()self.xpath_totalPrice()self.xpath_unitPrice()self.xpath_followInfo()self.xpath_tag()get_houseInfo = self.xpath_houseInfo()get_title = self.xpath_title()get_positionInfo=self.xpath_positionInfo()get_totalPrice = self.xpath_totalPrice()get_unitPrice = self.xpath_unitPrice()get_followInfo=self.xpath_followInfo()get_tag=self.xpath_tag()i = 1while True:data_houseInfo= next(get_houseInfo)data_title=next(get_title)data_positionInfo=next(get_positionInfo)data_totalPrice=next(get_totalPrice)data_unitPrice=next(get_unitPrice)data_followInfo=next(get_followInfo)data_tag=next(get_tag)with open("yufengqu.csv", "a", newline="", encoding="utf-8-sig") as f:fieldnames = ['houseInfo', 'title', 'positionInfo', 'totalPrice/万元', 'unitPrice', 'followInfo', 'tag']writer = csv.DictWriter(f, fieldnames=fieldnames) # 写入表头writer.writeheader()list_1 = ['houseInfo', 'title', 'positionInfo', 'totalPrice/万元', 'unitPrice', 'followInfo', 'tag']list_2 = [data_houseInfo,data_title,data_positionInfo,data_totalPrice,data_unitPrice,data_followInfo,data_tag]list_3 = dict(zip(list_1, list_2))writer.writerow(list_3)print("写入第"+str(i)+"行数据")i += 1if i > len(self.houseInfo):breakdef xpath_title(self):for i in range(len(self.title)):yield self.title[i]def xpath_positionInfo(self):for i in range(len(self.positionInfo)):yield self.positionInfo[i]def xpath_totalPrice(self):for i in range(len(self.totalPrice)):yield self.totalPrice[i]def xpath_unitPrice(self):for i in range(len(self.unitPrice)):yield self.unitPrice[i]def xpath_followInfo(self):for i in range(len(self.followInfo)):yield self.followInfo[i]def xpath_tag(self):for i in range(len(self.tag)):yield self.tag[i]def run(self):i = 1while True:url_str = self.url.format(i) # 构造请求urlhtml = self.get_response_spider(url_str)self.get_content_html(html)self.qingxi_data_houseInfo()i += 1if i == 100: # 不包括100页break# if __name__ == "__main__":# lanjia = LanjiaSpider()# lanjia.run()class MyspiderSpider(scrapy.Spider):name = 'myspider'allowed_domains = ['https://wh.lianjia.com/ershoufang/jianghan/']start_urls = ['https://wh.lianjia.com/ershoufang/jianghan//']def parse(self, response):print('爬取ing....')lanjia = LanjiaSpider()lanjia.run()
数据可视化:(优化版)
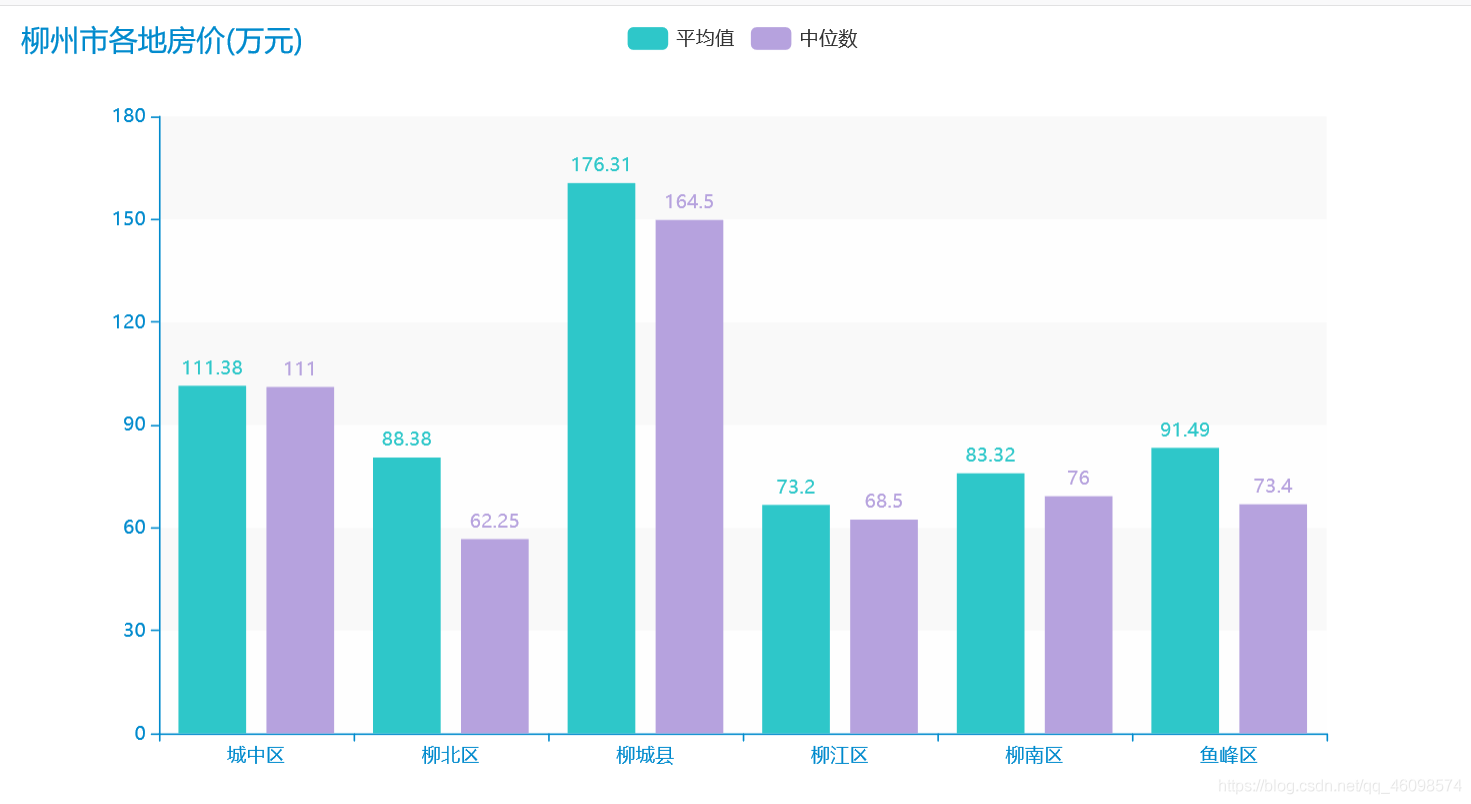
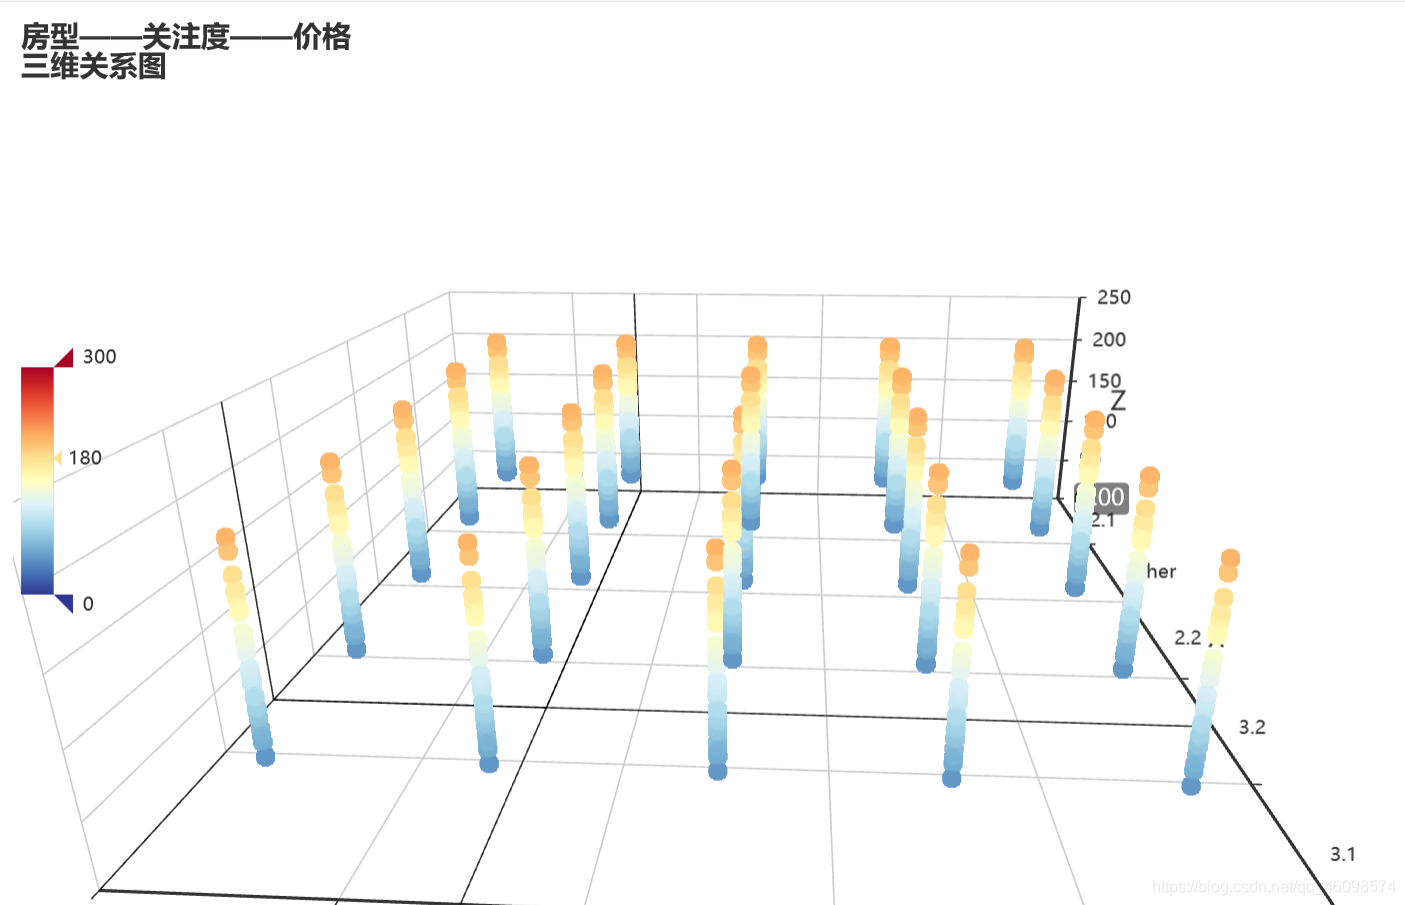
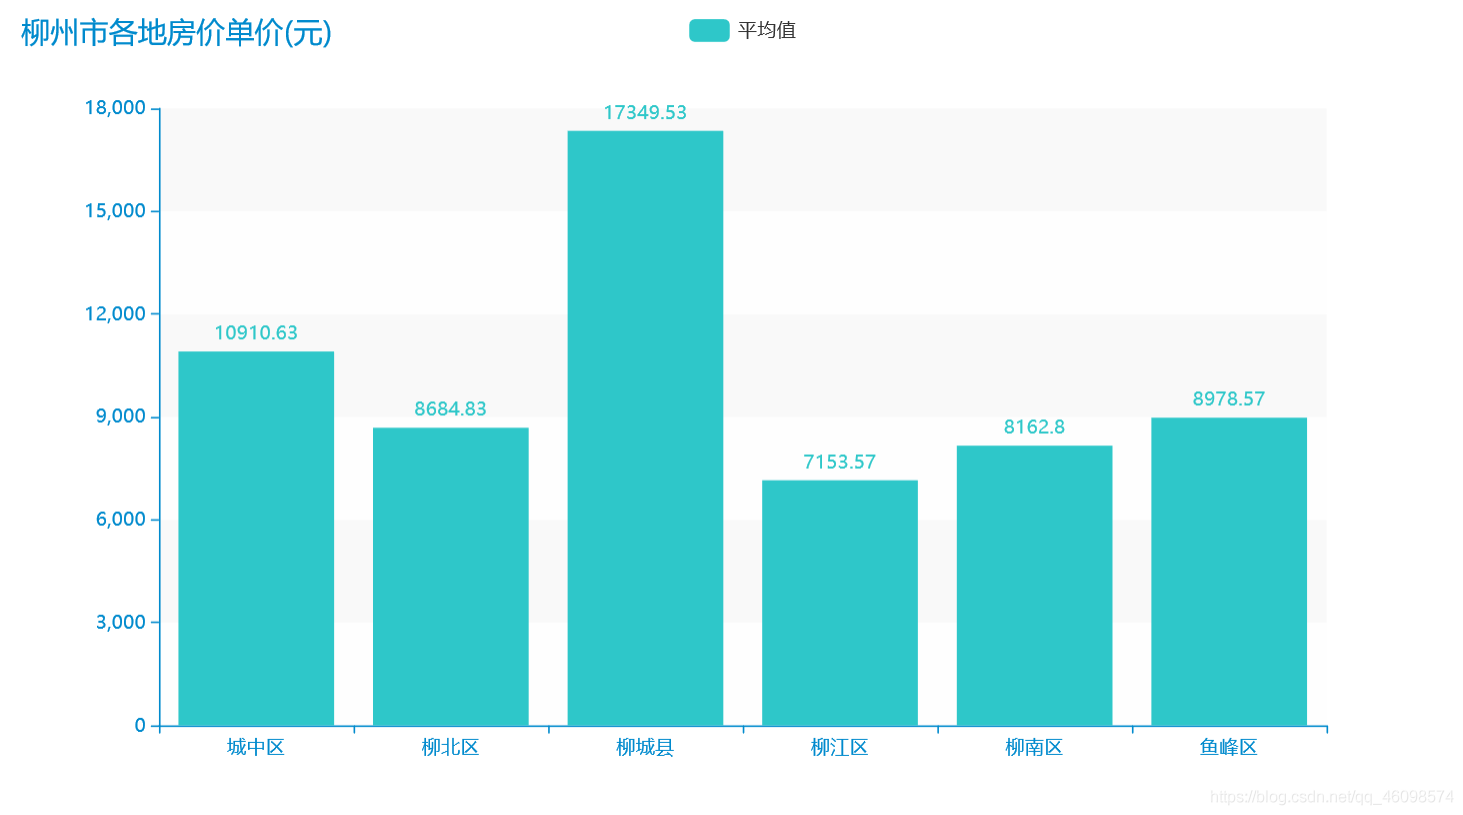
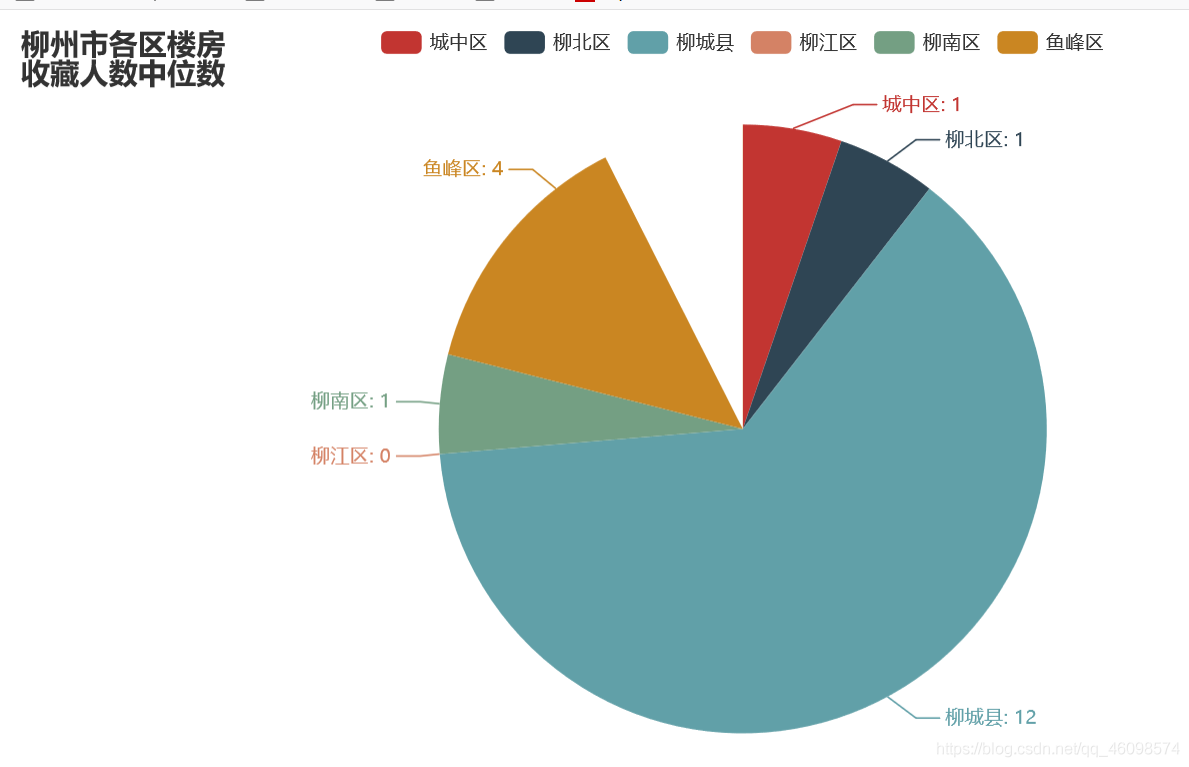
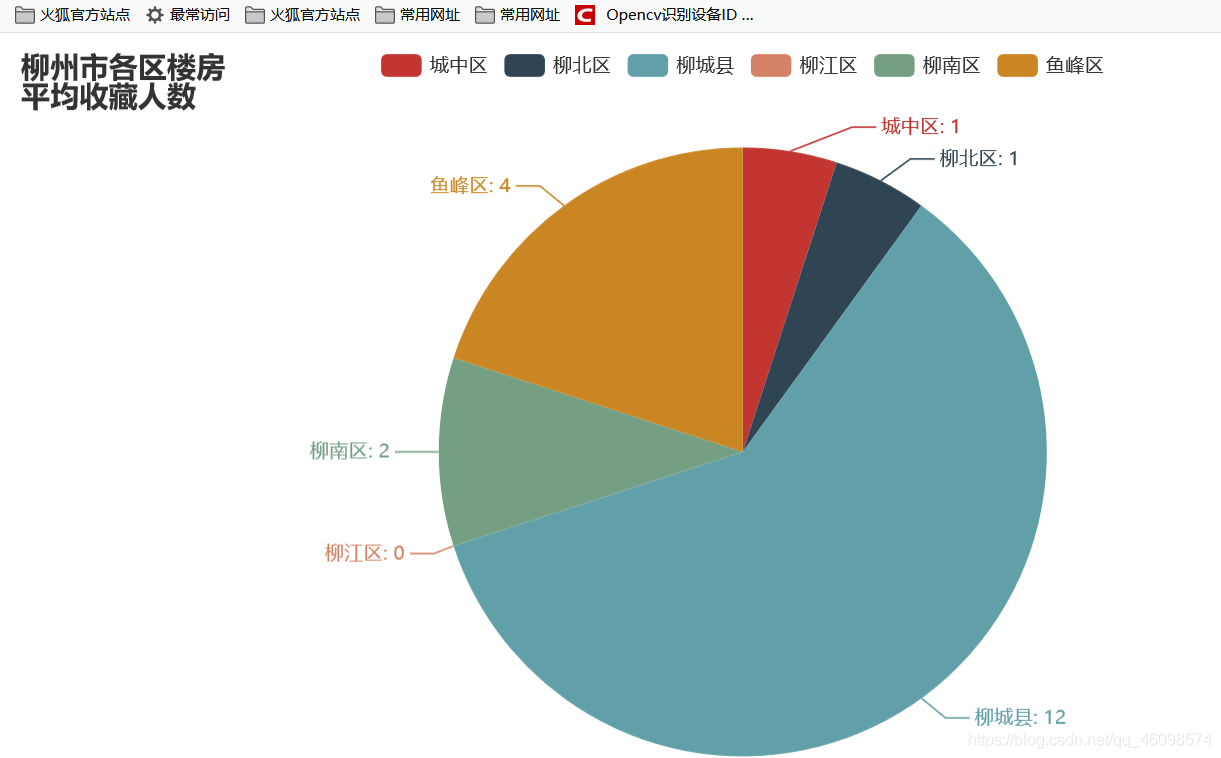
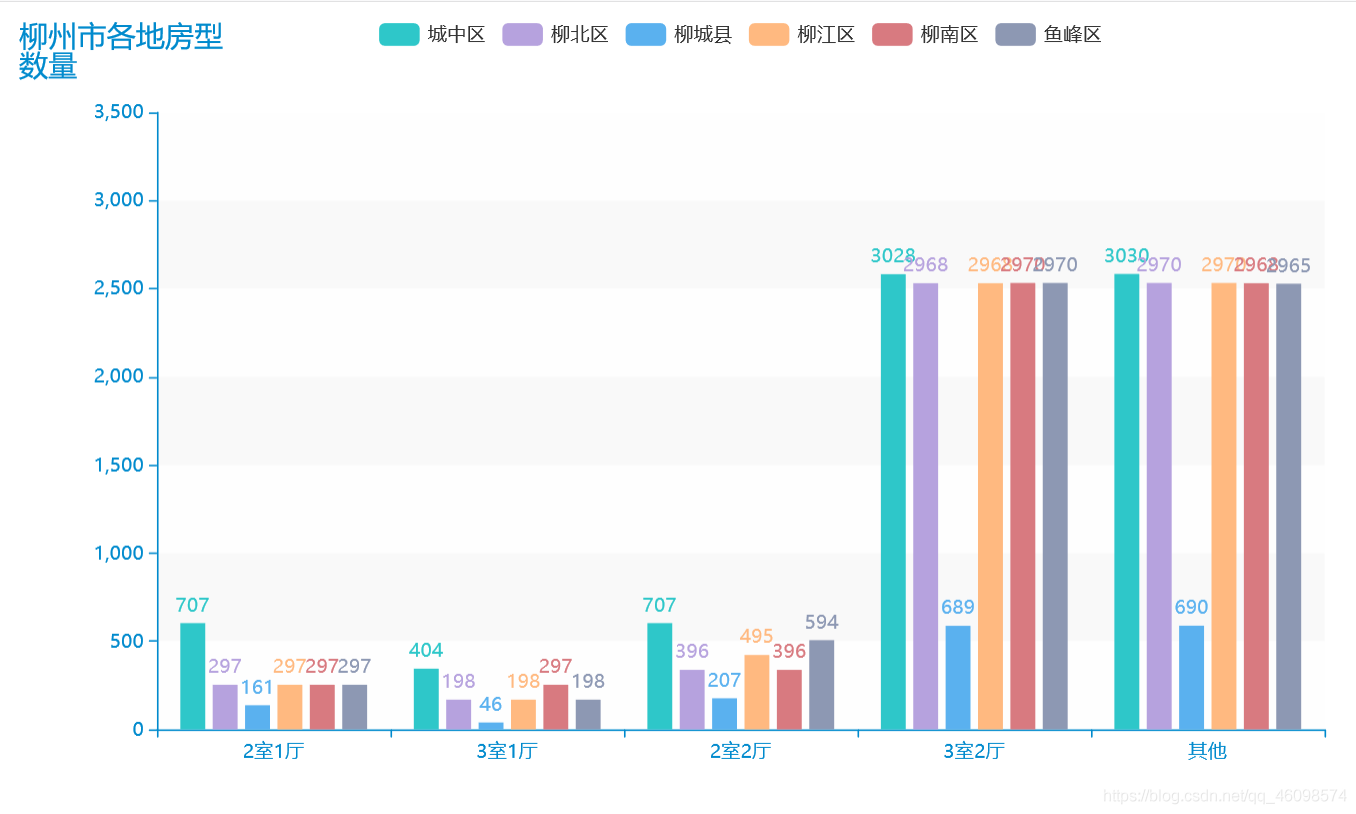
"""数据分析及可视化auuthor: 周小夏"""import pandas as pdfrom pyecharts.charts import Line, Barimport numpy as npfrom pyecharts.globals import ThemeTypefrom pyecharts.charts import Piefrom pyecharts import options as optsplaces = ['chengzhongqu', 'liubeiqu', 'liuchengxian', 'liujiangqu', 'liunanqu', 'yufengqu']place = ['城中区', '柳北区', '柳城县', '柳江区', '柳南区', '鱼峰区']avgs = [] # 房价均值median = [] # 房价中位数favourate_avg = [] # 房价收藏人数均值favourate_median = [] # 房价收藏人数中位数houseidfo = ['2室1厅', '3室1厅', '2室2厅', '3室2厅', '其他'] # 房型定义houseidfos = ['2.1', '3.1', '2.2', '3.2']sum_house = [0, 0, 0, 0, 0] # 各房型数量sum_houses = []price = [] # 房价均值unitprice = [] # 单价fav = [] # 收藏人数type = []area = [] # 房间def avg(name):df = pd.read_csv('./spiders/' + str(name)+'.csv', encoding='utf-8')pattern = '\d+'df['totalPrice/万元'] = df['totalPrice/万元'].str.findall(pattern)df['followInfo'] = df['followInfo'].str.findall(pattern)df['houseInfo'] = df['houseInfo'].str.findall(pattern)df['unitPrice'] = df['unitPrice'].str.findall(pattern)sum_houses = [0, 0, 0, 0, 0]# print(sum_house)avg_work_year = []areas = []unit_avg = []medians = []favourates = []k = 0k1 = 0k3 = 0k4 = 0for i in range(len(df)):if (i + 1) % 2 == 0:continueelse:if len(df['unitPrice'][i]) >= 0:unit_avg.append(','.join(df['unitPrice'][i]).replace(',', '.'))if len(df['totalPrice/万元'][i]) >= 0:avg_work_year.append(','.join(df['totalPrice/万元'][i]).replace(',', '.'))medians.append(float(','.join(df['totalPrice/万元'][i]).replace(',', '.'))*100)price.append(','.join(df['totalPrice/万元'][i]).replace(',', '.'))if len(df['followInfo'][i]) ==2:favourates.append(int(','.join(df['followInfo'][i][:1])))fav.append(int(','.join(df['followInfo'][i][:1])))if float(','.join(df['houseInfo'][i][:2]).replace(',', '.')) == 2.1:k +=1sum_houses[0] =ktype.append(2.1)if float(','.join(df['houseInfo'][i][:2]).replace(',', '.')) == 3.1:k1 +=1sum_houses[1] =k1type.append(3.1)if float(','.join(df['houseInfo'][i][:2]).replace(',', '.')) == 2.2:k3 +=1sum_houses[2] =k3type.append(2.2)if float(','.join(df['houseInfo'][i][:2]).replace(',', '.')) == 3.2:k4 +=1sum_houses[3] =k4type.append(3.2)else:k4 +=1sum_houses[4] = k4type.append('other')areas.append(float(','.join(df['houseInfo'][i][2:4]).replace(',', '.')))sum_house[0] =sum_houses[0]sum_house[1] = sum_houses[1]sum_house[2] = sum_houses[2]sum_house[3] = sum_houses[3]sum_house[4] = sum_houses[4]sum_house.append(sum_house[0])sum_house.append(sum_house[1])sum_house.append(sum_house[2])sum_house.append(sum_house[3])sum_house.append(sum_house[4])# print(sum_houses)favourates.sort()favourate_median.append(int(np.median(favourates)))medians.sort()median.append(np.median(medians))# price = avg_work_yearb = len(avg_work_year)*100b1= len(favourates)b2 = len(unit_avg)b4 = len(areas)*100sum = 0sum1 = 0for i in unit_avg:sum = sum+float(i)unitprice.append(round(sum/b2, 2))for i in areas:sum = sum+float(i)area.append(round(sum/b4, 2))for i in avg_work_year:sum = sum+float(i)avgs.append(round(sum/b, 2))for i in favourates:sum1 = sum1+float(i)favourate_avg.append(round(int(sum1/b1), 2))for i in places:avg(i)print("各区平均房价", avgs)print('各房型的出售总数:', sum_house)print("房间面积", area)print("房价单价", unitprice)a = []for i in median:a.append(i/100)# print(median)# print(favourate_avg,favourate_median)line = Line()line.add_xaxis(place)line.add_yaxis("柳州市各地房价平均值(万元)", avgs)line.add_yaxis("柳州市各地房价中位数值(万元)", a)line.render("predict_line.html")def bar() -> Bar:c = (Bar({"theme": ThemeType.MACARONS}).add_xaxis(place).add_yaxis("平均值", unitprice).set_global_opts(title_opts={"text": "柳州市各地房价单价(元)"}))return cbar().render("unit_prices.html")def bar() -> Bar:c = (Bar({"theme": ThemeType.MACARONS}).add_xaxis(place).add_yaxis("平均值", avgs).add_yaxis("中位数", a).set_global_opts(title_opts={"text": "柳州市各地房价(万元)"}))return cbar().render("predict_bar.html")# print(sum_house)def bar() -> Bar:c = (Bar({"theme": ThemeType.MACARONS}).add_xaxis(houseidfo).add_yaxis(place[0], sum_house[0:5]).add_yaxis(place[1], sum_house[5:10]).add_yaxis(place[2], sum_house[10:15]).add_yaxis(place[3], sum_house[15:20]).add_yaxis(place[4], sum_house[20:25]).add_yaxis(place[-1], sum_house[25:30])# .add_yaxis("中位数", favourate_median).set_global_opts(title_opts={"text": "柳州市各地房型\n数量"}))return cbar().render("house_bar.html")line = Line()line.add_xaxis(place)line.add_yaxis("柳州市各地房子平均面积\n(平米)", area)line.render("Area_line.html")list_num = favourate_avgattr = place# print(zip(attr, list_num))s = [list(z) for z in zip(attr, list_num)]c = (Pie().add("", s).set_global_opts(title_opts=opts.TitleOpts(title="柳州市各区楼房\n平均收藏人数")).set_series_opts(label_opts=opts.LabelOpts(formatter="{b}: {c}")))c.render("pie_avg.html")list_num = favourate_medianattr = place# print(zip(attr, list_num))s = [list(z) for z in zip(attr, list_num)]c = (Pie().add("", s).set_global_opts(title_opts=opts.TitleOpts(title="柳州市各区楼房\n收藏人数中位数")).set_series_opts(label_opts=opts.LabelOpts(formatter="{b}: {c}")))c.render("pie_median.html")from pyecharts import options as optsfrom pyecharts.charts import Scatter3Dfrom pyecharts.faker import Fakerline = Line()line.add_xaxis(place)line.add_yaxis("房间面积\n(平米)", area)line.add_yaxis("房价\n(/万元)", avgs)line.render("price1_line.html")price=[float(i)/1 for i in price]# print(price)# types=list(map(mapfunc,df.house_type.values))# type = [224, 56, 168, 1680, 1670]data = []# print(fav,type)# for j in range(len(type)):# for k in range(len(fav)):for j in range(100):for k in range(100):for i in range(500):try:data.append([type[j], favourate_avg[k],price[i]])except:continue# print(data)scatter = (Scatter3D(init_opts=opts.InitOpts(width='900px', height='600px')) # 初始化.add("", data,grid3d_opts=opts.Grid3DOpts(width=300, depth=300, rotate_speed=300, is_rotate=True,),)# 设置全局配置项.set_global_opts(title_opts=opts.TitleOpts(title="房型——关注度——价格\n三维关系图"), # 添加标题visualmap_opts=opts.VisualMapOpts(max_=300, # 最大值pos_top=200, # visualMap 组件离容器上侧的距离range_color=Faker.visual_color # 颜色映射)).render("3D散点图.html"))print('数据分析和可视化结束,左边点开~')
最后,别忘记了关注公众号~
分享最新算法!
[外链图片转存失败,源站可能有防盗链机制,建议将图片保存下来直接上传(img-
CiQYvfTG-1594979733395)(D:\CSDN\pic\WeChat Image_20200716151357.jpg)]

若有收获,就点个赞吧
0 人点赞
