同一个病人的 SNV 分布
数据准备
首先还是同样的读入数据,进行一定的处理。我们同样用 VEP 注释后的 maf 文件,然后取出需要用到的几列
rm(list = ls())options(stringsAsFactors = F)library(dplyr)library(stringr)# 读入数据laml = read.maf('./7.annotation/vep/VEP_merge.maf')laml@data = laml@data[!grepl('^MT-', laml@data$Hugo_Symbol),]# 增加一列t_vaf,即肿瘤样本中突变位点的覆盖深度t_alt_count占测序覆盖深度t_depth的比值laml@data$t_vaf = (laml@data$t_alt_count/laml@data$t_depth)unique(laml@data$Tumor_Sample_Barcode)getSampleSummary(laml)getGeneSummary(laml)getFields(laml)mut = laml@data[laml@data$t_alt_count >= 5 &laml@data$t_vaf >= 0.05, c("Hugo_Symbol","Chromosome","Start_Position","Tumor_Sample_Barcode","t_vaf")]mut$patient = substr(mut$Tumor_Sample_Barcode, 1, 5)
最后的数据框如下:
> mut[1:6,1:6]Hugo_Symbol Chromosome Start_Position Tumor_Sample_Barcode t_vaf patient1: ADGRB2 chr1 31756671 case1_biorep_A_techrep 0.06976744 case12: PTPRF chr1 43569766 case1_biorep_A_techrep 0.15000000 case13: TCTEX1D1 chr1 66770463 case1_biorep_A_techrep 0.08816121 case14: C1orf68 chr1 152719922 case1_biorep_A_techrep 0.24267782 case15: ARHGEF11 chr1 156936822 case1_biorep_A_techrep 0.27027027 case16: OCLM chr1 186401109 case1_biorep_A_techrep 0.09800919 case1
可视化
最后用 pheatmap 进行可视化,因为有 6 个病人,所以可以写个循环
pid = unique(mut$patient)lapply(pid , function(p){# p = 'case1'print(p)mat = unique(mut[mut$patient == p,c("Tumor_Sample_Barcode",'Hugo_Symbol')])mat$tmp = 1# 长变扁mat = spread(mat,Tumor_Sample_Barcode,tmp,fill = 0)class(mat)mat = as.data.frame(mat)rownames(mat) = mat$Hugo_Symbolmat = mat[,-1]dat = mat[order(mat[,1],mat[,2],mat[,3],mat[,4]),]png(paste0('overlap_', p, '.png'),width = 300, height = 1500)pheatmap::pheatmap(mat = dat, cluster_cols = F, cluster_rows = F, show_rownames = T, legend = F,fontsize_row = 16,fontsize_col = 30)dev.off()})
可以看到,每个病人的 4 个样本都存在一些共有的 SNV 位点,每个样本也存在一些自己特有的 SNV 位点。

肿瘤样本中的异质性
肿瘤通常是异质性的,即由多个克隆组成。在这里,我们通过肿瘤样本中的变异等位基因频率(Variant Allele Frequecy) t_vaf 值,来进行分析。使用的是 maftools 的 inferHeterogeneity 函数:
rm(list = ls())options(stringsAsFactors = F)library(dplyr)library(stringr)# 读入数据laml = read.maf('./7.annotation/vep/VEP_merge.maf')laml@data = laml@data[!grepl('^MT-',laml@data$Hugo_Symbol),]# 增加一列 t_vaf,即肿瘤样本中突变位点的覆盖深度t_alt_count占测序覆盖深度t_depth的比值laml@data$t_vaf = (laml@data$t_alt_count/laml@data$t_depth)heter = inferHeterogeneity(maf = laml, top = 24,vafCol = 't_vaf')
得到的 heter 是一个列表,包含 clusterData 和 clusterMeans 两个子列表,数据结构如下:
$clusterDataHugo_Symbol Chromosome Start_Position End_Position Tumor_Sample_Barcode t_vaf cluster MATH MedianAbsoluteDeviation1: PRAMEF10 1 12893425 12893425 case3_biorep_B 0.03738318 2 90.29305 1.7781562: RLF 1 40236041 40236041 case3_biorep_B 0.01913876 2 90.29305 1.7781563: SZT2 1 43425554 43425554 case3_biorep_B 0.02339181 2 90.29305 1.7781564: TTF2 1 117076781 117076781 case3_biorep_B 0.03973510 2 90.29305 1.7781565: ATP1A4 1 160156111 160156111 case3_biorep_B 0.03703704 2 90.29305 1.778156---3025: SIX4 14 60714074 60714074 case6_biorep_A_techrep 0.10000000 2 77.05084 2.8674513026: DDX28 16 68021645 68021645 case6_biorep_A_techrep 0.10714286 2 77.05084 2.8674513027: ZNF571 19 37564702 37564702 case6_biorep_A_techrep 0.35555556 2 77.05084 2.8674513028: ZXDA X 57908964 57908964 case6_biorep_A_techrep 0.18367347 2 77.05084 2.8674513029: SAMD12 8 118379433 118379433 case6_biorep_A_techrep 0.06818182 outlier 77.05084 2.867451$clusterMeansTumor_Sample_Barcode cluster meanVaf1: case3_biorep_B 2 0.0279588572: case3_biorep_B 4 0.3306330043: case3_biorep_B 3 0.0899348054: case3_biorep_B 1 0.0119400065: case3_biorep_B outlier 0.565873016---87: case5_biorep_C 2 0.37804144888: case5_biorep_C 3 0.82316082589: case6_biorep_A_techrep 1 0.03567007690: case6_biorep_A_techrep 2 0.19829786291: case6_biorep_A_techrep outlier 0.068181818
用绘图函数进行可视化,先以样本 case1_biorep_A_techrep 作为示例:
plotClusters(clusters = heter,showCNvars = T,tsb = 'case1_biorep_A_techrep')
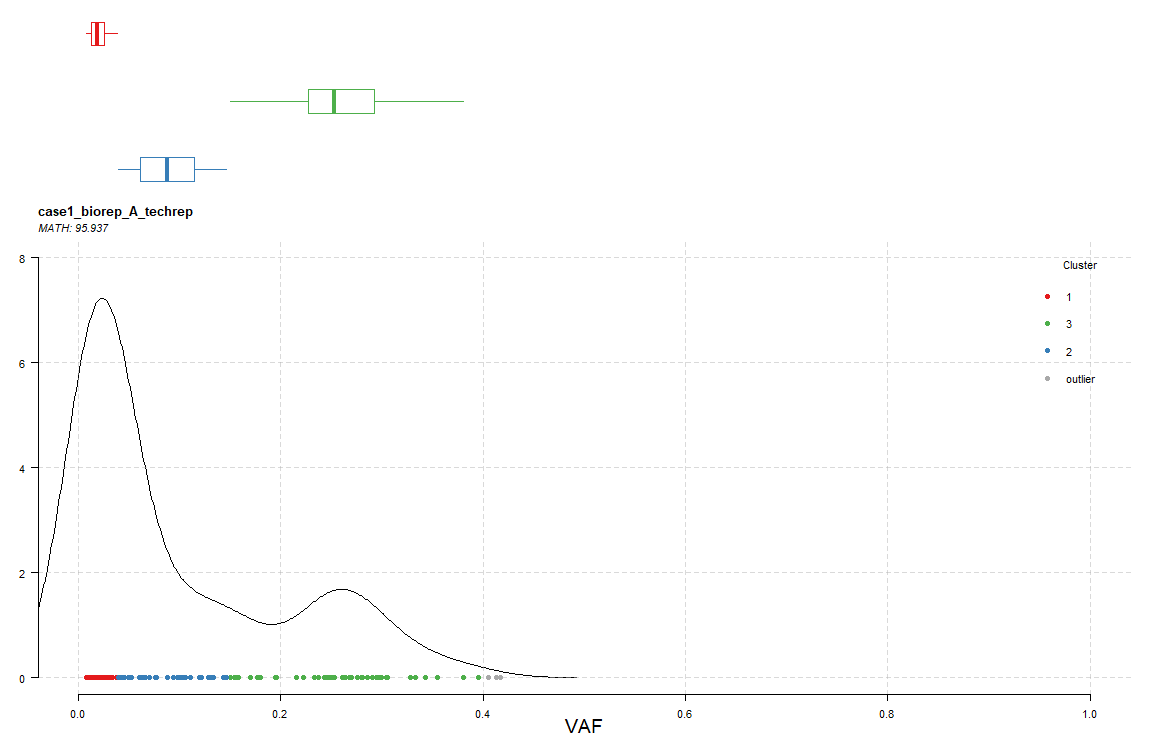
上图显示了不同的突变位点的 vaf 值,并将这些位点进行分群,在样本 case1_biorep_A_techrep 中就可以分为3 群,即该样本可以分为 3 个克隆,同样还给出了 MATH 值:95.937。关于 MATH 值的计算方法,可以参考:使用Mutant-allele tumor heterogeneity(MATH)算法评估肿瘤异质性
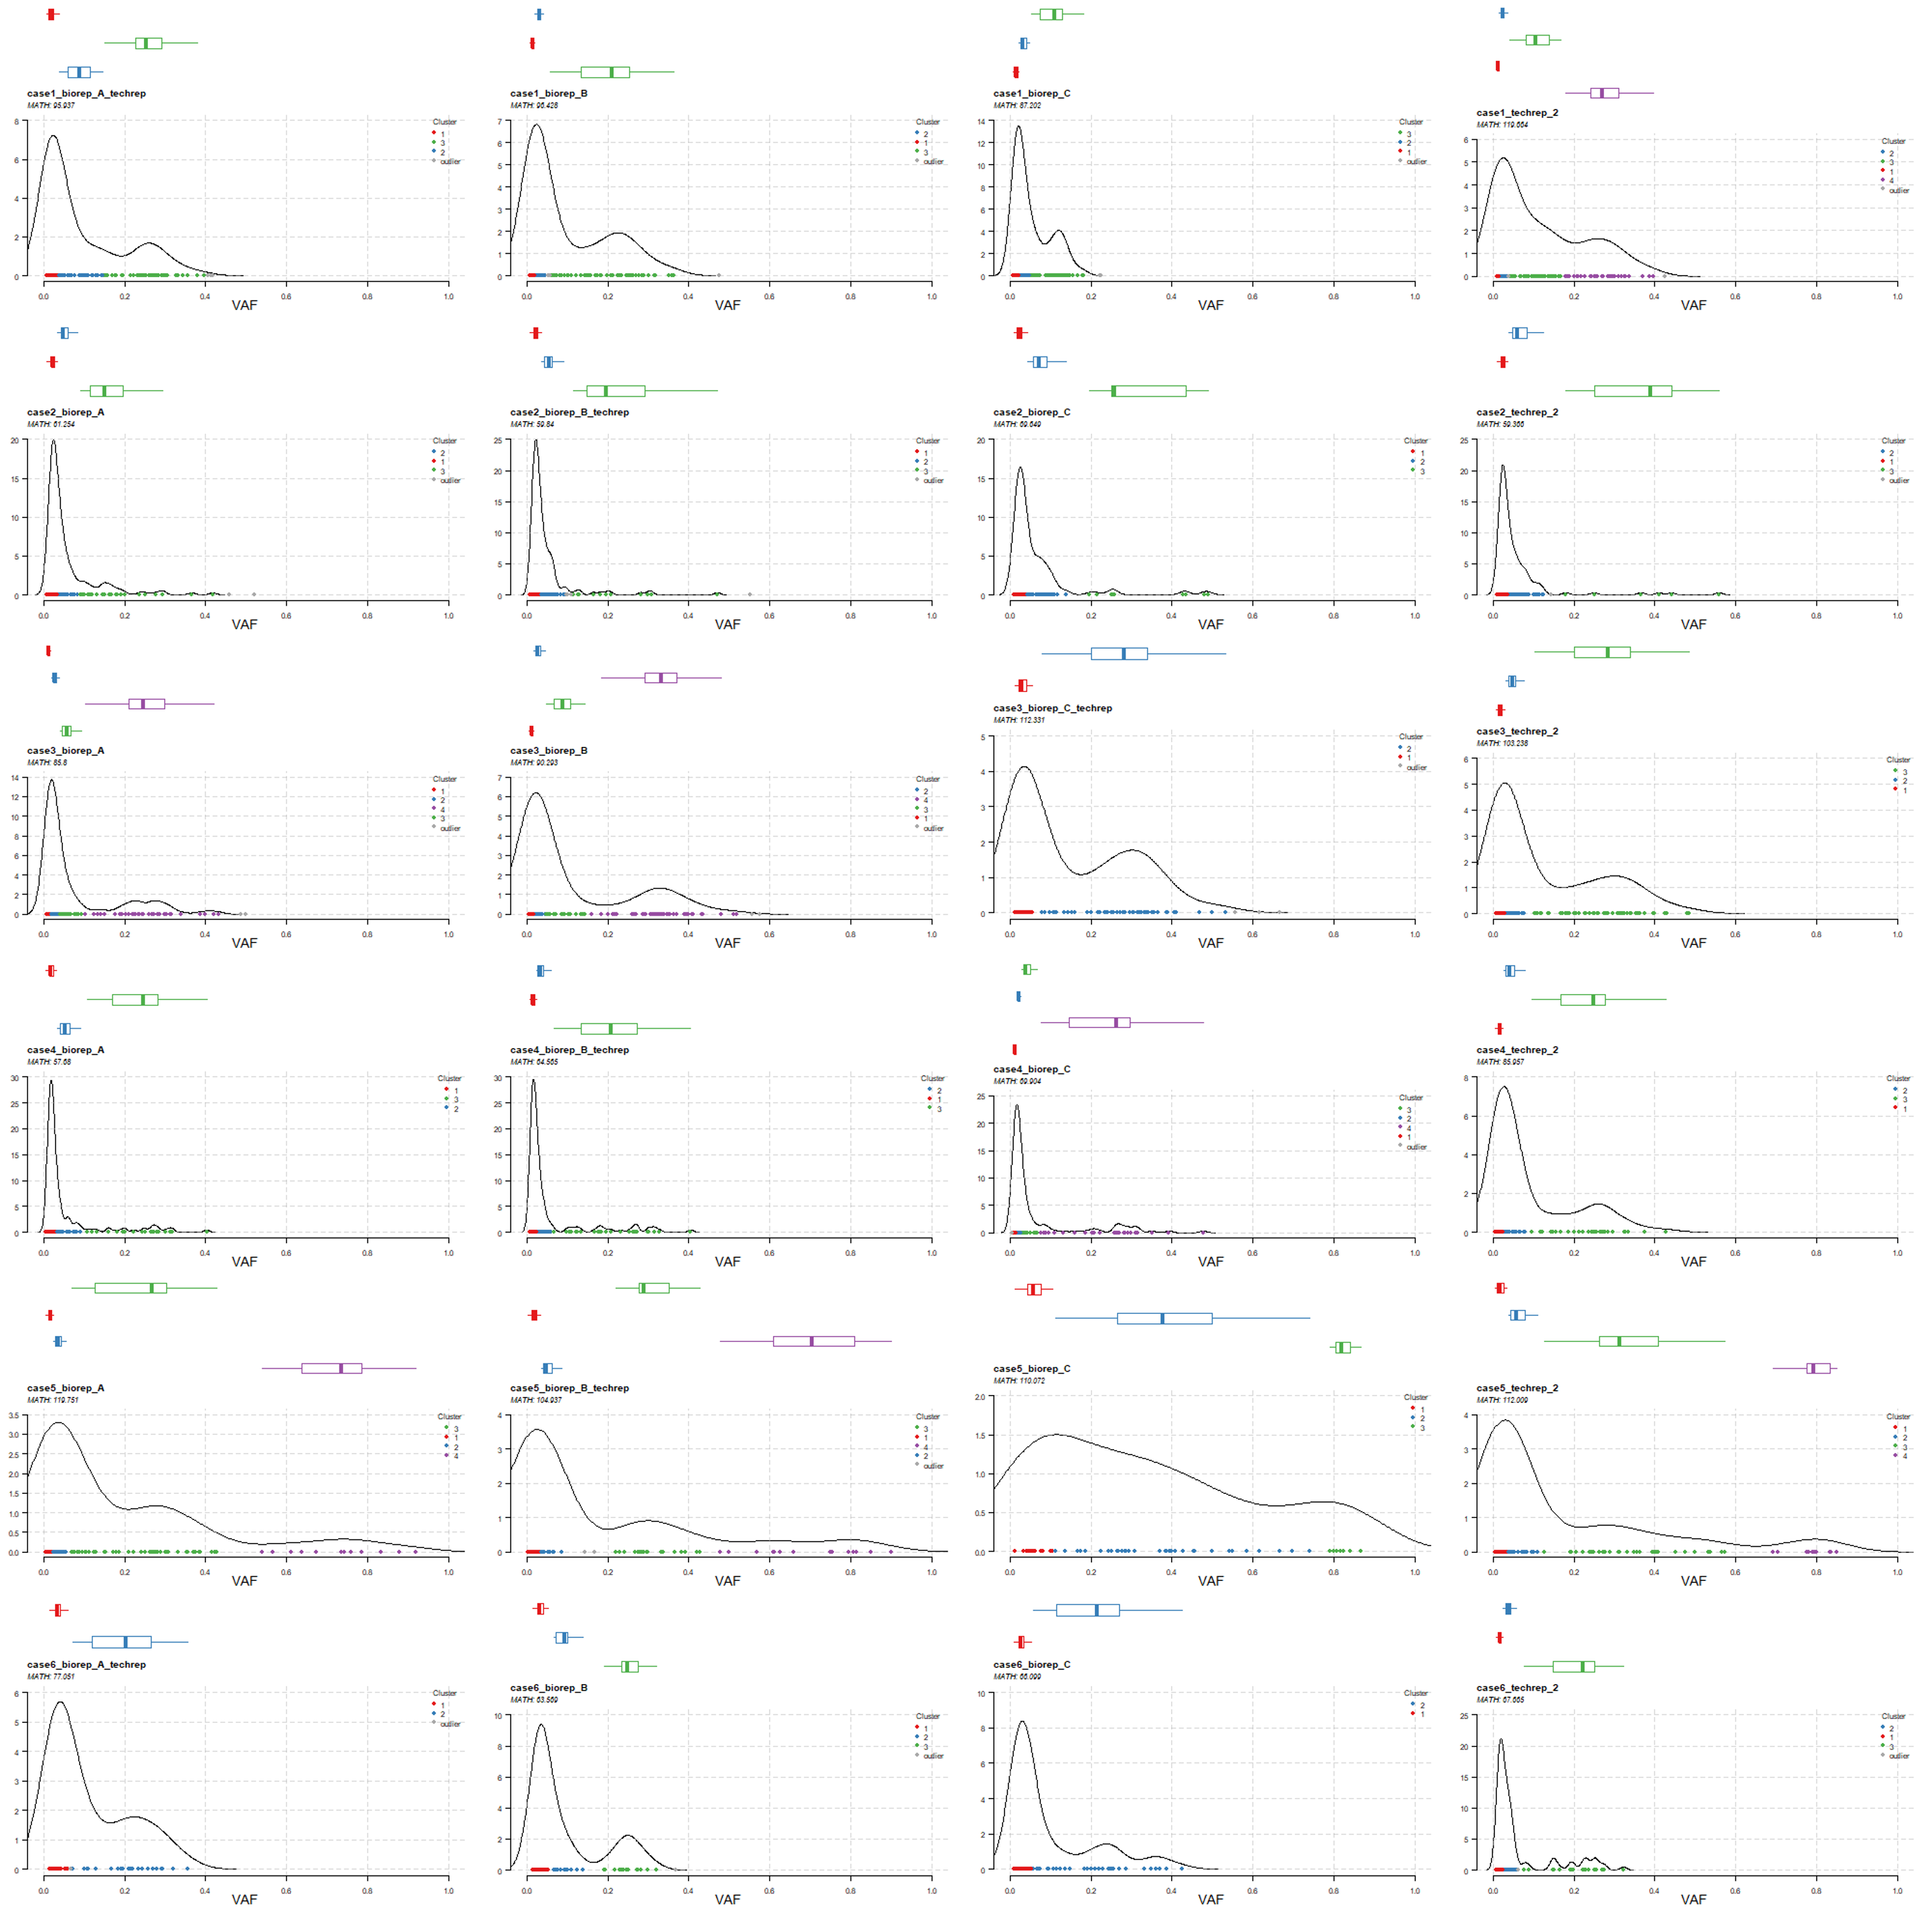
当然,我们可以把所有样本的 vaf 结果都可视化出来。
for (i in unique(laml@data$Tumor_Sample_Barcode)) {# i = 'case1_biorep_A_techrep'png(paste0('vaf_', i, '.png'),width = 500, height = 330)plotClusters(clusters = heter,tsb = i,showCNvars = T)dev.off()}
这个函数计算的 MATH 值或者克隆数量,本身就是该肿瘤样本的新属性,所以很多数据挖掘文章就会拿这个新属性对肿瘤病人进行分类后看其它组学的特性的差异,从而发表自己的数据挖掘文章

若有收获,就点个赞吧
0 人点赞
