简介
Graph 是最基础的图类,G6 技术栈中所有关系图都是由该类负责绘制。
创建 Graph 的方式如下:
new G6.Graph(cfg);
创建一个 graph 实例,返回一个 Graph 对象,建议在单个容器上只初始化一个 Graph 实例。参数 cfg 详见下列配置项。
配置项
container
需传入 dom 容器或者容器id {domObject || string} [必选]
width
画布宽,单位像素 {number} [可选]
不设置则自适应父容器宽
height
画布宽,单位像素 {number} [可选]
不设置则自适应父容器高
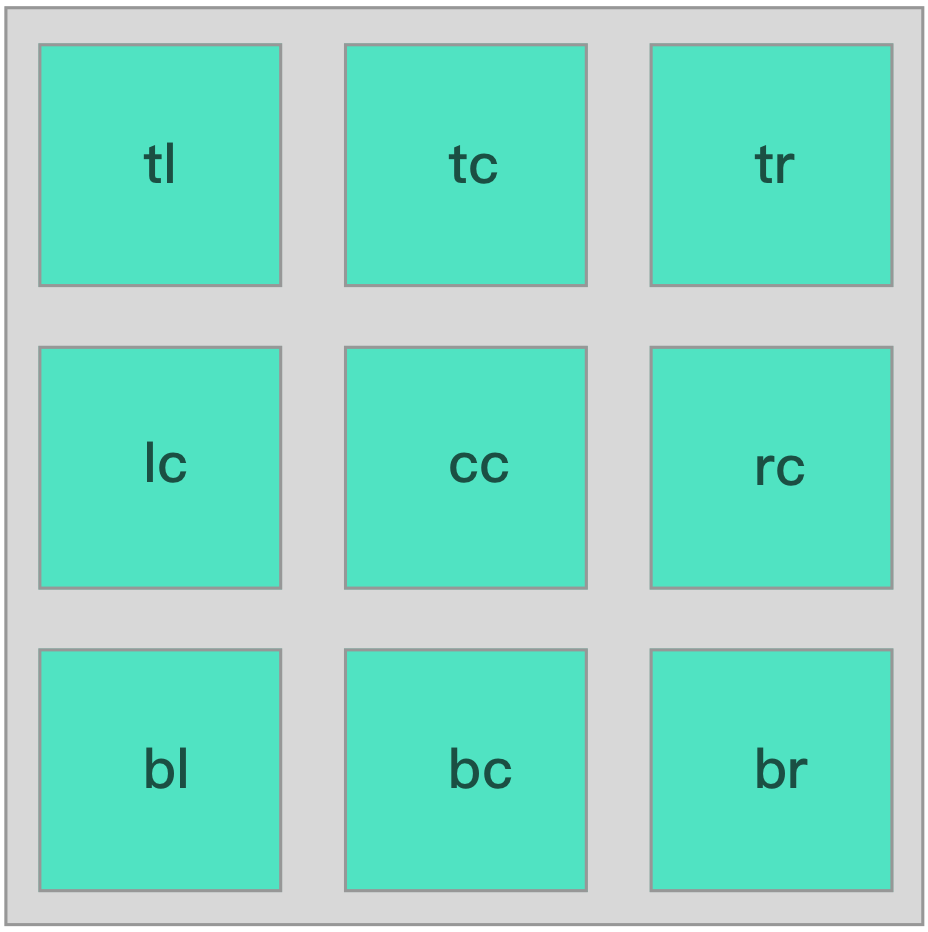
fitView
初始化视口区域 {string} [可选]
候选值为: ‘tl’, ‘lc’, ‘bl’, ‘cc’, ‘tc’, ‘tr’, ‘rc’, ‘br’, ‘bc’, ‘autoZoom’
fitViewPadding
视口适应画布边距 {number || array} [可选]
minZoom
最小缩放倍率 {number} [可选]
maxZoom
最大缩放倍率 {number} [可选]
modes
模式集 {object} [可选]
可按如下格式设置默认行为:
new Graph({modes: {default: ['hehaviourName']}});
mode
当前模式 {string} 默认: default
plugins
插件集 {array}
layout
布局参数 {object|function|object}
type`` {plainObject}
{auto: {boolean}, // 是否在画布数据变更后自动布局 默认 是trueprocesser: {object|function}, // 布局处理器}
type`` {function}
(nodes, edges)=>{// nodes 节点集// edges 边集// 在此处进行布局}
type`` {object}
{excute() {this.nodes; // 节点集this.edges; // 边集this.graph; // 当前图类}}
方法
save
保存当前图数据
graph.save(); // 返回图数据
read
读取并渲染图数据。
graph.read(data);
参数:
data`` {object} 数据模型
导入的数据模型,以下健名在 G6 中有特定含义,是保留字段,用户在设置自有数据时应 避免使用 。用以下格式传入数据:
{nodes:[],edges:[],groups: [],guides: []}
节点的数据模型
{id: 'node1', // id 必须唯一color: '#333', // 颜色size: 10 || [10, 10], // 尺寸 || [宽, 高]shape: 'circle', // 所用图形style: { // 关键形样式(优先级高于color)fill: 'red',stroke: 'blue'},label: '文本标签' || { // 文本标签 || 文本图形配置text: '文本标签',fill: 'green'},parent: 'group1', // 所属组index: 1, // 渲染层级}
边的数据模型
{id: 'edge1', // id 必须唯一source: 'node1', // 源节点 idtarget: 'node2', // 目标节点 idcontrolPoints: [{ // 控制点x: 10,y: 10}],sourceAnchor: 0, // 源节点锚点targetAnchor: 2, // 目标节点锚点color: 'red', // 颜色size: 3, // 尺寸shape: 'line', // 所用图形style: { // 关键形样式(优先级高于color)fill: 'red',stroke: 'blue'},label: '文本标签' || { // 文本标签 || 文本图形配置text: '文本标签',fill: 'green'},parent: 'group1', // 所属组index: 1, // 渲染层级}
群组的数据模型
{id: 'group1', // id 必须唯一color: '#333', // 颜色size: 10 || [10, 10], // 尺寸 || [宽, 高]shape: 'circle', // 所用图形style: { // 关键形样式(优先级高于color)fill: 'red',stroke: 'blue'},label: '文本标签' || { // 文本标签 || 文本图形配置text: '文本标签',fill: 'green'},parent: 'group2', // 所属组
示例
const data = {nodes: [{id: 'node1',x: 100,y: 200},{id: 'node2',x: 300,y: 200}],edges: [{id: 'edge1',target: 'node2',source: 'node1'}]};const graph = new G6.Graph({container: 'mountNode',width: 500,height: 500});graph.read(data);
on
事件监听
参数
eventName{string} 事件名 <br />callback {function} 事件回调函数
事件对象
{currentItem, // drag 拖动子项currentShape, // drag 拖动图形shape, // 图形对象item, // 子项domEvent, // 原生的 dom 事件x, // 图横坐标y, // 图纵坐标domX, // dom横坐标domY, // dom纵坐标action, // 数据变更动作 add、update、remove、changeDatatoShape, // mouseleave、dragleave 到达的图形toItem, // mouseleave、dragleave 到达的子项
鼠标事件
这类事件可以与前缀 ‘’ ( 空即任意 ), ‘node’,’edge’,’group’, ‘guide’,自由组合使用:
graph.on('click', (ev)=>{}); // 鼠标左键点击事件graph.on('dblclick', (ev)=>{}); // 鼠标左键双击事件graph.on('mouseenter', (ev)=>{}); // 鼠标移入事件graph.on('mouseleave', (ev)=>{}); // 鼠标移出事件graph.on('mousedown', (ev)=>{}); // 鼠标按下事件graph.on('mouseup', (ev)=>{}); // 鼠标抬起事件graph.on('mousemove', (ev)=>{}); // 鼠标移动事件graph.on('dragstart', (ev)=>{}); // 鼠标开始拖拽事件graph.on('drag', (ev)=>{}); // 鼠标拖拽事件graph.on('dragend', (ev)=>{}); // 鼠标拖拽结束事件graph.on('dragenter', (ev)=>{}); // 鼠标拖拽进入事件graph.on('dragleave', (ev)=>{}); // 鼠标拖拽移出事件graph.on('drop', (ev)=>{}); // 鼠标拖拽放置事件graph.on('contextmenu', (ev)=>{}); // 菜单事件
其它事件
graph.on('keydown', function(ev){}); // 键盘按键按下事件graph.on('keyup', function(ev){}); // 键盘按键抬起事件graph.on('wheel', function(ev){}); // 滚轮事件graph.on('beforechangesize', function(ev){}) // 画布尺寸变化前graph.on('afterchangesize', function(ev){}) // 画布尺寸变化后graph.on('beforeviewportchange', function(ev){}) // 视口变化前graph.on('afterviewportchange', function(ev){}) // 视口变化后graph.on('beforechange', function(ev){}) // 子项数据变化前graph.on('afterchange', function(ev){}) // 子项数据变化后
find
查询
graph.find(id);
参数
id`` {string} 项 id
返回
item`` {object || undefined}
查询成功返回项对象,否则返回 undefinde``
示例
// 查询 id 为 node1 的项graph.find('node1')
add
新增项
graph.add(type, model)
参数
type{string} 项类型 可以是 node 、edge、guide
model`` {object} 数据模型
示例
// 添加一个节点graph.add('node', {x: 50,y: 50})
remove
删除项
graph.remove(item)
参数
item`` {string || object} 项 id 或 项对象
示例
// 删除 id 为 node1 的项graph.remove('node1')// 删除 node1 项const node1 = graph.find('node1');graph.remove(node1);
update
更新项
graph.update(item, model)
参数
item{string || object} 项 id 或 项对象<br />model {object} 数据模型
示例
// 将 id 为 node1 的项 x 更新为 100graph.update('node1', {x: 100});// 将 node1 项 x 更新为 100const node1 = graph.find('node1');graph.update(node1, {x: 100}));
node
参数
mappingObject {object} 映射对象
为了提高效率,数据导入、导出简单一致,G6 2.0 中取消映射数据和原始数据的隔离,并把映射的泛化为一般的映射概念,用户可以往里面写入任何值,任何映射规则。例如:
graph.node({custom: customValue});
每种映射通道都支持,单值和回调函数 ,例如:
graph.node({color: 'red',size(model) {if (model.type === 'a') {return 10;}return 20;}});
默认图形,支持以下几个视觉通道:
/***节点颜色映射*@param {string|function} param 支持通用颜色*/graph.node({color: param});/***节点尺寸映射*@param {number|array|function} param*Number 长宽均为该值*Array [width, height] 长宽*/graph.node({size: param});/***节点形状映射*@param {string|function} param*/graph.node({shape: param});/***节点文本映射*@param {string|function|object} param*/graph.node({label: param});/***节点样式映射*@param {object|function} param*/graph.node({style: param});
edge
参数
mappingObject {object} 映射对象
为了提高效率,数据导入、导出简单一致,G6 2.0 中取消映射数据和原始数据的隔离,并把映射的泛化为一般的映射概念,用户可以往里面写入任何值,任何映射规则。例如:
graph.edge({custom: customValue});
每种映射通道都支持,单值和回调函数 ,例如:
graph.edge({color: 'red',size(model) {if (model.type === 'a') {return 10;}return 20;}});
默认图形,支持一下几个视觉通道:
/***边颜色映射*@param {string|function} param 支持通用颜色*/graph.edge({color: param});/***边粗细映射*@param {number|function} param*/graph.edge({size: param});/***边形状映射*@param {string|function} param*/graph.edge({shape: param});/***边文本映射*@param {string|function|object} param*/graph.edge({label: param});/***样式映射*@param {object} param*/graph.edge({style: param});
group
参数
mappingObject {object} 映射对象
为了提高效率,数据导入、导出简单一致,G6 2.0 中取消映射数据和原始数据的隔离,并把映射的泛化为一般的映射概念,用户可以往里面写入任何值,任何映射规则。例如:
graph.group({custom: customValue});
每种映射通道都支持,单值和回调函数 ,例如:
graph.group({label: 'group',style(model) {if (model.type === 'a') {return {stroke: 'red'};}return {stroke: 'blue'};}});
默认图形,支持一下几个视觉通道:
/***群组文本映射*@param {string|function|object} param*/graph.group({label: param});/***群组样式映射*@param {object|function} param*/graph.group({style: param});
getDomPoint
通过图坐标获取 dom 坐标。
graph.getDomPoint(graphPoint)
参数
graphPoint`` {object} 图坐标
返回
domPoint`` {object} dom 坐标
示例
// 获取画布上图坐标为 (50, 50) 的 dom 坐标graph.getDomPoint({x: 50,y: 50});
getPoint
通过 dom 坐标获取图坐标。
graph.getPoint(domPoint)
参数
domPoint`` {object} dom 坐标
返回
graphPoint`` {object} 图坐标
示例
// 获取画布上 dom 坐标为 (50, 50) 的图坐标graph.getPoint({x: 50,y: 50});
focusPoint
聚焦某点,即将视口中心移动到该点
graph.focusPoint(graphPoint);
参数
graphPoint`` {object} 图坐标
示例
// 将画布中心聚焦到图坐标 (50, 50)graph.focusPoint({x: 50,y: 50});
focus
聚焦某项
graph.focus(item)
参数
item`` {string || object} 项 id 或 项对象
示例
// 将画布中心聚焦到 id 为 node1 的项中心graph.focus('node1');// 将画布中心聚焦到 node1 项中心const node1 = graph.focus('node1');graph.focus(node1);
zoom
使用方法(一)
graph.zoom(scale); // 以画布中心,进行缩放
参数
scale`` {number} 缩放比率
示例
// 以画布中心为缩放点,将画布缩放到实际尺寸的 1/2graph.zoom(0.5);
使用方法(二)
graph.zoom(graphPoint, scale); // 以图坐标 point 中心,进行缩放
参数
graphPoint{object} 缩放中心<br />scale {number} 缩放比率
示例
// 以图坐标 (100, 100) 为缩放点,将画布缩放到实际尺寸的 1/2graph.zoom({x: 100,y: 100}, 0.5);
translate
平移画布
graph.translate(dx, dy);
参数
dx{number} 右方向为正,平移 dx 距离<br />dy {number} 下方向为正,平移 dy 距离
示例
// 画布向右平移 50,向下平移 50graph.translate(50, 50);
changeSize
改变画布尺寸
graph.changeSize(width, height);
参数
width{number} 画布宽 <br />height {number} 画布高
示例
// 将画布尺寸修改为 500 * 500graph.changeSize(500, 500);
setFitView
适应视口
graph.setFitView(fitView);
参数
fitView`` {string} 参数同 fitView
示例
// 将图相对于画布居中graph.setFitView('cc');
getZoom
获取画布缩放比率
graph.getZoom();
返回
scale`` {number} 缩放比率
getWidth
获取画布宽
graph.getWidth();
返回
width`` {number} 画布宽
getHeight
获取画布高
graph.getHeight();
返回
height`` {number} 画布高
getItems
获取图内所有项
graph.getItems();
返回
items`` {array} 所有项
getNodes
获取图内所有节点
graph.getNodes();
返回
nodes`` {array} 节点集
getEdges
获取图内所有边
graph.getEdges();
返回
edges`` {array} 边集
getGroups
获取图内所有群组
graph.getGroups();
返回
groups`` {array} 群组集合
getGuides
获取图内所有导引
graph.getGuides();
返回
guides`` {array} 导引集合
preventAnimate
阻止动画,回掉函数中的执行代码,将不会做动画。
graph.preventAnimate(callback);
参数
callback`` {function} 无动画执行函数

若有收获,就点个赞吧
0 人点赞
