- 启动后会监听9100端口
- 添加为服务方式启动
[root@VM_2-44 ~]# vim /usr/lib/systemd/system/node_exporter.service
[Unit]
Description=node_exporter
After=network.target - 启动node_exporter
systemctl daemon-reload
systemctl start node_exporter
1
2
3
4
5
6
7
8
9
10
11
12
13
14
15
16
17
18
19
20
21
22
3.1.3 普罗米修斯服务端配置文件添加监控项
[root@VM_2-45 /usr/local/prometheus]# cat prometheus.yml
# my global config
global:
scrape_interval: 15s # Set the scrape interval to every 15 seconds. Default is every 1 minute.
evaluation_interval: 15s # Evaluate rules every 15 seconds. The default is every 1 minute.
# scrape_timeout is set to the global default (10s). - Alertmanager configuration
alerting:
alertmanagers:
- static_configs:
- targets:
# - alertmanager:9093 - Load rules once and periodically evaluate them according to the global ‘evaluation_interval’.
rule_files:
scrape_configs:
- job_name: ‘prometheus’
static_configs:
- targets: [‘192.168.2.45:9090’] - 添加上面三行
1
2
3
4
5
6
7
8
9
10
11
12
13
14
15
16
17
18
19
20
21
22
23
24
25
26
3.1.4 重启普罗米修斯
[root@VM_2-45 /usr/local/prometheus]# systemctl restart prometheus.service
1
打开普罗米修斯自带的监控页面,Status -> Targets 查看: - 启动后会监听9104端口
1
2
3
4
5
6
7
8
9
10
3.2.2 普罗米修斯配置文件添加监控项后重启
[root@VM_2-45 /usr/local/prometheus]# vim prometheus.yml
- job_name: ‘mysql’
static_configs:
- targets: [‘192.168.2.44:9104’] - 监控客户端,docker服务,nginx服务,sshd
1
2
3
4
5
6
7
8
9
10
11
12
13
14
如果要监控节点的系统服务,需要在后面添加名单参数
–collector.systemd.unit-whitelist=”.+” 从systemd中循环正则匹配单元
–collector.systemd.unit-whitelist=”(docker|sshd|nginx).service” 白名单,收集目标 - https://pan.baidu.com/s/1LIkVC0o3lyTT59JbX0mSpg 提取码:gf1d">默认redis-exporter端口为9121
- job_name: ‘Redis’
static_configs:
- targets: [‘192.168.2.44:9121’]
1
2
3
4
5
6
5.4 grafana导入画好的dashboard
链接:https://pan.baidu.com/s/1LIkVC0o3lyTT59JbX0mSpg 提取码:gf1d - my global config
global:
scrape_interval: 15s # Set the scrape interval to every 15 seconds. Default is every 1 minute.
evaluation_interval: 15s # Evaluate rules every 15 seconds. The default is every 1 minute.
# scrape_timeout is set to the global default (10s). - Alertmanager configuration
alerting:
alertmanagers:
- static_configs:
- targets:
# - alertmanager:9093 - Load rules once and periodically evaluate them according to the global ‘evaluation_interval’.
rule_files:
scrape_configs:
- job_name: ‘prometheus’
static_configs:
- targets: [‘192.168.2.45:9090’] - 重启普罗米修斯
[root@VM_2-45 /usr/local/prometheus]# systemctl restart prometheus.service
1
2
3
4
5
6
7
8
9
10
11
12
13
14
15
16
17
18
19
20
21
22
23
24
25
26
27
28
29
30
31
32
33
34
35
- Prometheus普罗米修斯,搭建和使用
1.1 prometheus监控框架工具介绍
prometheus是由谷歌研发的一款开源的监控软件,它通过安装在远程机器上的exporter,通过HTTP协议从远程的机器收集数据并存储在本地的时序数据库上
同时Prometheus后端用 golang语言开发,前端是 Grafana
1.2 支持类型
Prometheus为了支持各种中间件以及第三方的监控提供了exporter,大家可以把它理解成监控适配器,将不同指标类型和格式的数据统一转化为Prometheus能够识别的指标类型。
例如Node exporter主要通过读取Linux的/proc以及/sys目录下的系统文件获取操作系统运行状态,reids exporter通过Reids命令行获取指标,mysql exporter通过读取数据库监控表获取MySQL的性能数据。他们将这些异构的数据转化为标准的Prometheus格式,并提供HTTP查询接口。
[外链图片转存失败,源站可能有防盗链机制,建议将图片保存下来直接上传(img-ovE8puOM-1615534500766)(FB2D85A532DE4EA0B6378CCE4AF0E677)]
Prometheus的流行和Kubernetes密不可分,支持对Kubernetes、容器、OpenStack的监控。
- Prometheus 源码安装和启动配置
IP 角色 系统
192.168.2.45 Prometheus 服务端 CentOS 7
192.168.2.44 node_exporter 客户端 CentOS 7
普罗米修斯下载网址:https://prometheus.io/download/
监控集成器下载地址:http://www.coderdocument.com/docs/prometheus/v2.14/instrumenting/exporters_and_integrations.html
[root@VM_2-45 ~]# wget https://github.com/prometheus/prometheus/releases/download/v2.25.0/prometheus-2.25.0.linux-amd64.tar.gz[root@VM_2-45 ~]# tar xf prometheus-2.25.0.linux-amd64.tar.gz -C /usr/local[root@VM_2-45 ~]# mv prometheus-2.25.0.linux-amd64/ prometheus
查看版本号
[root@VM_2-45 /usr/local/prometheus]# ./prometheus --versionprometheus, version 2.25.0 (branch: HEAD, revision: a6be548dbc17780d562a39c0e4bd0bd4c00ad6e2)build user: root@615f028225c9build date: 20210217-14:17:24go version: go1.15.8platform: linux/amd64[root@VM_2-45 /usr/local/prometheus]#
查看帮助文档
[root@VM_2-45 /usr/local/prometheus]# ./prometheus --help
2.1 prometheus.yml 配置解释
# my global configglobal:# 默认情况下,每15s拉取一次目标采样点数据。scrape_interval: 15s # Set the scrape interval to every 15 seconds. Default is every 1 minute.# 每15秒评估一次规则。默认值为每1分钟。evaluation_interval: 15s # Evaluate rules every 15 seconds. The default is every 1 minute.# scrape_timeout is set to the global default (10s).# Alertmanager configurationalerting:alertmanagers:- static_configs:- targets:# - alertmanager:9093# Load rules once and periodically evaluate them according to the global 'evaluation_interval'.rule_files:# - "first_rules.yml"# - "second_rules.yml"# A scrape configuration containing exactly one endpoint to scrape:# Here it's Prometheus itself.scrape_configs:# job名称会增加到拉取到的所有采样点上,同时还有一个instance目标服务的host:port标签也会增加到采样点上- job_name: 'prometheus'# 覆盖global的采样点,拉取时间间隔5sscrape_interval: 5sstatic_configs:- targets: ['localhost:9090']
2.2 启动服务
# 启动服务
[root@VM_2-45 /usr/local/prometheus]# ./prometheus --config.file=prometheus.yml# 指定配置文件--config.file="prometheus.yml"# 默认指定监听地址端口,可修改端口--web.listen-address="0.0.0.0:9090"# 最大连接数--web.max-connections=512# tsdb数据存储的目录,默认当前data/--storage.tsdb.path="data/"# premetheus 存储数据的时间,默认保存15天--storage.tsdb.retention=15d# 通过命令热加载无需重启 curl -XPOST 192.168.2.45:9090/-/reload--web.enable-lifecycle# 可以启用 TLS 或 身份验证 的配置文件的路径--web.config.file=""启动选项了解:./prometheus --help
2.3 访问:http://localhost:9090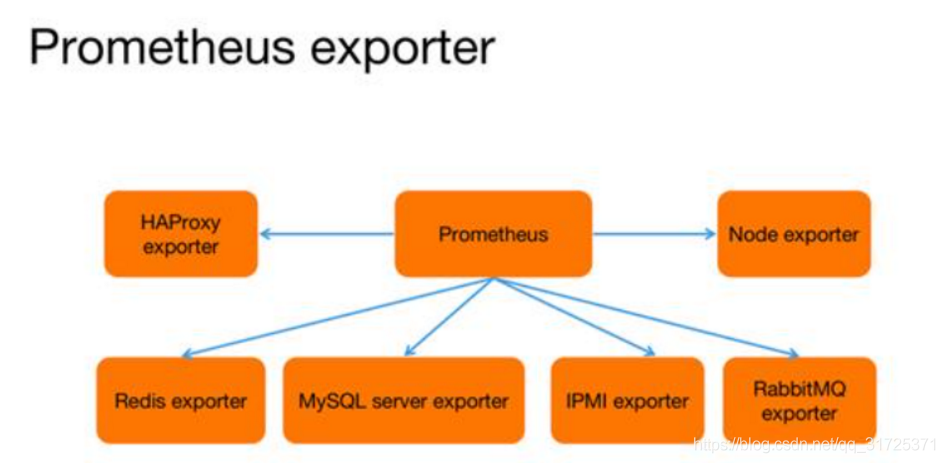
2.4 查看暴露指标
http://localhost:9090/metrics
2.5 将Prometheus配置为系统服务
1.进入systemd目录下:cd /usr/lib/systemd/system
[root@VM_2-45 ~]# cd /usr/lib/systemd/system
2.创建文件:vim prometheus.service
[Unit]Description=https://prometheus.io[Service]Restart=on-failureExecStart=/usr/local/prometheus/prometheus --config.file=/usr/local/prometheus/prometheus.yml --web.listen-address=:9090[Install]WantedBy=multi-user.target
3.生效系统system文件
systemctl daemon-reload
4.启动服务
[root@VM_2-45 ~]# systemctl start prometheus
1
3. 客户端,配置服务发现监控linux主机及相关服务
IP 角色 系统
192.168.2.45 Prometheus 服务端 CentOS 7
192.168.2.44 node_exporter 客户端 CentOS 7
3.1 客户端安装node_exporter
3.1.1 监控Linux 安装常用node_exporter
[root@VM_2-44 ~]# wget https://github.com/prometheus/node_exporter/releases/download/v1.1.2/node_exporter-1.1.2.linux-amd64.tar.gz
[root@VM_2-44 ~]# tar xf node_exporter-1.1.2.linux-amd64.tar.gz -C /usr/local/
[root@VM_2-44 ~]# mv node_exporter-1.1.2.linux-amd64/ node_exporter
1
2
3
4
3.1.2 启动node_exporter,并添加到服务
# 直接启动
[root@VM_2-44 /usr/local/node_exporter]# ./node_exporter &
启动后会监听9100端口
添加为服务方式启动
[root@VM_2-44 ~]# vim /usr/lib/systemd/system/node_exporter.service
[Unit]
Description=node_exporter
After=network.target
[Service]
ExecStart=/usr/local/node_exporter/node_exporter
Restart=on-failure
[Install]
WantedBy=multi-user.target
启动node_exporter
systemctl daemon-reload
systemctl start node_exporter
1
2
3
4
5
6
7
8
9
10
11
12
13
14
15
16
17
18
19
20
21
22
3.1.3 普罗米修斯服务端配置文件添加监控项
[root@VM_2-45 /usr/local/prometheus]# cat prometheus.yml
# my global config
global:
scrape_interval: 15s # Set the scrape interval to every 15 seconds. Default is every 1 minute.
evaluation_interval: 15s # Evaluate rules every 15 seconds. The default is every 1 minute.
# scrape_timeout is set to the global default (10s).
Alertmanager configuration
alerting:
alertmanagers:
- static_configs:
- targets:
# - alertmanager:9093
Load rules once and periodically evaluate them according to the global ‘evaluation_interval’.
rule_files:
scrape_configs:
- job_name: ‘prometheus’
static_configs:
- targets: [‘192.168.2.45:9090’]
- job_name: ‘linux’
static_configs:
- targets: [‘192.168.2.44:9100’,’192.168.2.43:9100’] # 多个用,分开
添加上面三行
1
2
3
4
5
6
7
8
9
10
11
12
13
14
15
16
17
18
19
20
21
22
23
24
25
26
3.1.4 重启普罗米修斯
[root@VM_2-45 /usr/local/prometheus]# systemctl restart prometheus.service
1
打开普罗米修斯自带的监控页面,Status -> Targets 查看:
3.2 监控mysql(mysqld-exporter)
Grafana使用这个模板链接: https://pan.baidu.com/s/1sVE5_oEUnak4vTU7XaT5ig 提取码: k5gi
[root@VM_2-44 ~]# wget https://github.com/prometheus/mysqld_exporter/releases/download/v0.12.1/mysqld_exporter-0.12.1.linux-amd64.tar.gz
[root@VM_2-44 ~]# tar xf mysqld_exporter-0.12.1.linux-amd64.tar.gz -C /usr/local/
[root@VM_2-44 /usr/local]# mv mysqld_exporter-0.12.1.linux-amd64 mysqld_exporter
[root@VM_2-44 /usr/local/mysqld_exporter]# vim .my.cnf
[client]
user=root
password=123456
1
2
3
4
5
6
7
3.2.1 启动mysqld-exporter
[root@VM_2-44 /usr/local/mysqld_exporter]# ./mysqld_exporter —config.my-cnf=”/usr/local/mysqld_exporter/.my.cnf” &
[root@VM_2-44 /usr/local/mysqld_exporter]# ps -ef |grep exporter
root 3447 3398 0 01:31 pts/1 00:00:02 ./node_exporter
root 4647 3398 0 02:13 pts/1 00:00:00 ./mysqld_exporter —config.my-cnf=/usr/local/mysqld_exporter/.my.cnf
root 4654 3398 0 02:13 pts/1 00:00:00 grep —color=auto exporter
[root@VM_2-44 /usr/local/mysqld_exporter]# ss -lntp |grep 4647
LISTEN 0 128 :::9104 :::* users:((“mysqld_exporter”,pid=4647,fd=3))
[root@VM_2-44 /usr/local/mysqld_exporter]#
启动后会监听9104端口
1
2
3
4
5
6
7
8
9
10
3.2.2 普罗米修斯配置文件添加监控项后重启
[root@VM_2-45 /usr/local/prometheus]# vim prometheus.yml
- job_name: ‘mysql’
static_configs:
- targets: [‘192.168.2.44:9104’]
1
2
3
4
5
重启普罗米修斯
[root@VM_2-45 /usr/local/prometheus]# systemctl restart prometheus.service
1
3.1.1 为了管理服务,将宿主机节点监控采集node_exporter加入到服务配置文件里
[root@VM_2-44 ~]# vi /usr/lib/systemd/system/node_exporter.service
[Unit]
Description=https://prometheus.io
[Service]
Restart=on-failure
ExecStart=/usr/local/node_exporter/node_exporter —collector.systemd —collector.systemd.unit-whitelist=(docker|sshd|nginx).service
[Install]
WantedBy=multi-user.target
监控客户端,docker服务,nginx服务,sshd
1
2
3
4
5
6
7
8
9
10
11
12
13
14
如果要监控节点的系统服务,需要在后面添加名单参数
–collector.systemd.unit-whitelist=”.+” 从systemd中循环正则匹配单元
–collector.systemd.unit-whitelist=”(docker|sshd|nginx).service” 白名单,收集目标
/usr/bin/node_exporter —collector.systemd —collector.systemd.unit-whitelist=(docker|sshd|nginx).service
- Grafana 展示 Prometheus 数据
wget https://mirrors.tuna.tsinghua.edu.cn/grafana/yum/rpm/grafana-7.4.3-1.x86_64.rpm
[root@VM_2-45 ~]# yum install initscripts fontconfig
[root@VM_2-45 ~]# yum install -y grafana-7.4.3-1.x86_64.rpm
[root@VM_2-45 ~]# systemctl status grafana-server.service
1
2
3
4
5
启动后访问地址:ip:3000
初始用户名和密码都是admin
4.1 添加Prometheus数据源
Configuration -> Data Sources ->add data source -> Prometheus
4.2 新增Dashboard Linux基础数据展示
Create -> import
4.2.2 导入模板8919
已经画好的模板链接: https://pan.baidu.com/s/1d70reg4Mro3Dh17bb-ZEVA 提取码: b6c1
更多grafana模板: https://grafana.com/grafana/dashboards 搜索 相应 dashboards的id如8919,12227
4.2.3 选择数据源
4.2.4 查看Dashboard
Dashboards ->Manage
4.3 新增Dashboard MySQL数据展示
上面3.2的内容完成后,在继续下面操作
4.3.1 设置数据源
数据库上授权远程账户
4.3.2 导入已经画好的dashboard,数据源选择刚刚创建好的mysql数据源即可
链接:https://pan.baidu.com/s/12S33kZkZd9gIXF8tMHKECg 提取码9b0s
或者链接:https://pan.baidu.com/s/1GBzogDLsYS3IvwH4WbdPLw 提取码:ef6e
将下载的json打开复制进去加载
- 监控Redis(redis_exporter)
链接:https://pan.baidu.com/s/12y7HxtQlBjFwr_i8ClM8Kw 提取码:13v2
5.1 安装redis_exporter
或者下载:
wget https://github.com/oliver006/redis_exporter/releases/download/v0.15.0/redis_exporter-v0.15.0.linux-amd64.tar.gz
1
2
tar -C /usr/local/ -xvf redis_exporter-v0.15.0.linux-amd64.tar.gz
1
5.2启动redis_exporter
默认redis_exporter端口为9121
./redis_exporter redis//192.168.0.103:6379 & -web.listenaddress 192.168.0.103:9121
1
5.3 prometheus配置文件中加入redis监控并重启
vim /usr/local/Prometheus/prometheus.yml
默认redis-exporter端口为9121
- job_name: ‘Redis’
static_configs:
- targets: [‘192.168.2.44:9121’]
1
2
3
4
5
6
5.4 grafana导入画好的dashboard
链接:https://pan.baidu.com/s/1LIkVC0o3lyTT59JbX0mSpg 提取码:gf1d
- 监控windows机器(wmi-exporter)
https://github.com/martinlindhe/wmi_exporter/releases
wmi-exporter下载地址:https://github.com/prometheus-community/windows_exporter/releases/download/v0.16.0/windows_exporter-0.16.0-amd64.msi
双击即可完成安装 ,被监控windows机器安装wmi-exporter,会自动创建一个开机自启的服务
验证服务是否启动,默认wmi-exporter端口为9182
修改Prometheus配置文件
my global config
global:
scrape_interval: 15s # Set the scrape interval to every 15 seconds. Default is every 1 minute.
evaluation_interval: 15s # Evaluate rules every 15 seconds. The default is every 1 minute.
# scrape_timeout is set to the global default (10s).
Alertmanager configuration
alerting:
alertmanagers:
- static_configs:
- targets:
# - alertmanager:9093
Load rules once and periodically evaluate them according to the global ‘evaluation_interval’.
rule_files:
scrape_configs:
- job_name: ‘prometheus’
static_configs:
- targets: [‘192.168.2.45:9090’]
job_name: ‘linux’
static_configs:
- targets: [‘192.168.2.44:9100’]job_name: ‘mysql’
static_configs:
- targets: [‘192.168.2.44:9104’]job_name: ‘windows’
static_configs:
- targets: [‘192.168.2.125:9182’]
重启普罗米修斯
[root@VM_2-45 /usr/local/prometheus]# systemctl restart prometheus.service
1
2
3
4
5
6
7
8
9
10
11
12
13
14
15
16
17
18
19
20
21
22
23
24
25
26
27
28
29
30
31
32
33
34
35
访问http://192.168.2.45:9090/targets 查看监控信息,
grafana导入画好的dashboard,选择普罗米修斯数据源
链接: https://pan.baidu.com/s/1-9Sch1IYZvR1DeimMz7_mQ 提取码: xh6v
或者dashboard Id为:10467的模板

若有收获,就点个赞吧
0 人点赞
