配置 nginx格式为 json,这样便于人性化阅读,也方便将 nginx日志对接到 elk(elasticsearch+logstash+kibana) 日志管理中心。
这里要说明一点:日志格式修改为 json,对 nginx没有任何影响,请放心修改。
我们以 nginx.conf 为例进行配置演示
user www www;worker_processes auto;pid /var/run/nginx.pid;events {use epoll ;worker_connections 4096;multi_accept on;}http {include mime.types;default_type application/octet-stream;vhost_traffic_status_zone;vhost_traffic_status_filter_by_host on;sendfile on;tcp_nopush on;tcp_nodelay on;keepalive_timeout 65;server_names_hash_bucket_size 512 ;client_header_buffer_size 128k;large_client_header_buffers 8 64k;client_max_body_size 500m;#这里定义 access 日志格式 为json格式log_format json '{"created_at":"$time_iso8601",''"remote_addr":"$remote_addr",''"method":"$request_method",''"request":"$request",''"status":"$status",''"size":$body_bytes_sent,''"referer": "$http_referer",''"http_host":"$http_host",''"response_time":$request_time,''"http_x_forwarded_for":"$http_x_forwarded_for",''"user_agent": "$http_user_agent"''}' ;# 接口访问日志的最后一个参数 json 是前面定义的,这里引用一下access_log /usr/local/nginx/logs/access.log json;# 注意:错误日志没有格式,nginx 默认语法即可error_log /usr/local/nginx/logs/error.log;server{listen 80 ;# 站点域名,没有的话,写项目名称即可server_name www.ginskeleton.com ;charset utf-8 ;location / {root /usr/local/nginx/html;index index.html index.htm;}# 提供 nginx 运行指标采集接口,供 prometheus 软件采集location /status {vhost_traffic_status_display;vhost_traffic_status_display_format html;}# 以下是静态资源缓存配置location ~ .*\.(gif|jpg|jpeg|png|bmp|swf)${expires 30d;}location ~ .*\.(js|css)?${expires 12h;}location ~ /\.{deny all;}}}
最终生成的日志格式: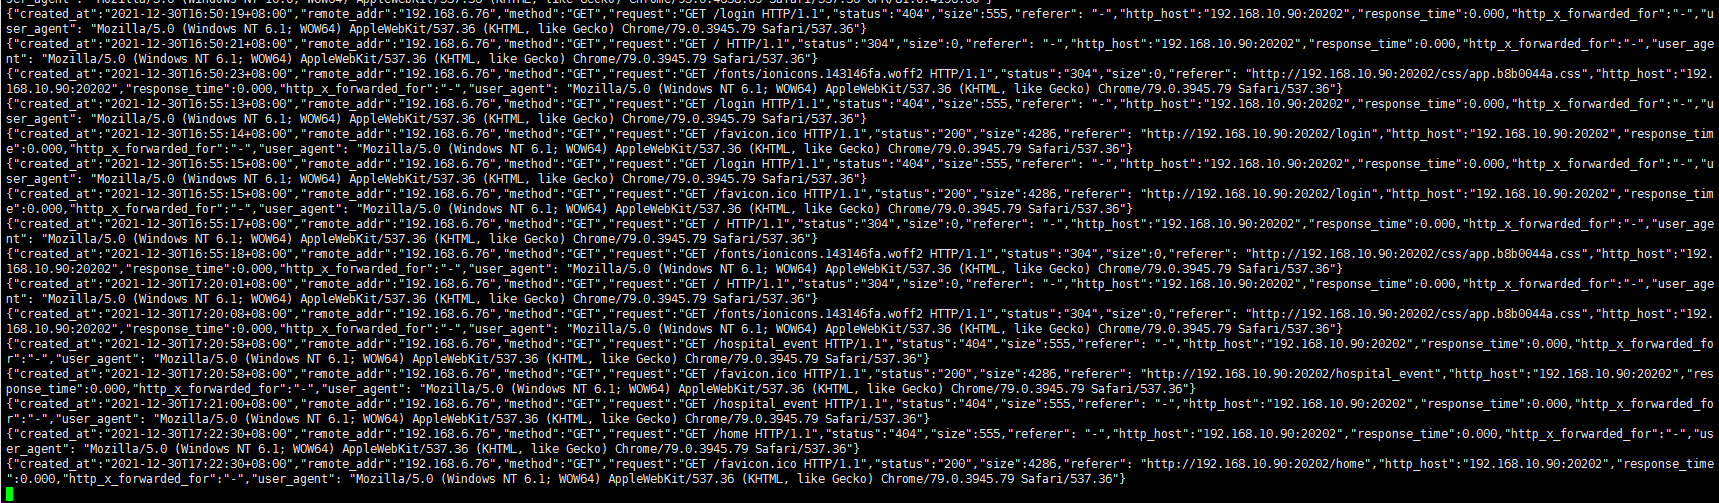

若有收获,就点个赞吧
0 人点赞
