我有一条线,可以连接全世界!
相信我,看完这篇文章,你就会画各种线了。
开始之前,先创建一张画布,文章使用的 d3 是 v5 版本:
const width = 500, height = 500;const svg = d3.select('body').append('svg').attr('width', width).attr('height', height);
为了方便观察,在开始和结束位置分别画两个圆
const x1 = 10, y1 = 10, x2 = 200, y2 = 200; // 开始,结束点的坐标值// 开始点svg.append('circle').attr('cx', x1).attr('cy', y1).attr('r', 5).style('fill', 'none').style('stroke', 'purple').style('stroke-width', 2);// 结束点svg.append('circle').attr('cx', x2).attr('cy', y2).attr('r', 5).style('fill', 'none').style('stroke', 'purple').style('stroke-width', 2);
1. 直线
最简单的线条:直线。
以下代码展示了用直线将两点连接起来:
const straightLineGroup = svg.append('g');straightLineGroup.append('path').attr('d', 'M' + x1 + ',' + y1 + ' L' + x2 + ',' + y2).style('fill', 'none').style('stroke', 'green').style('stroke-width', 2);
效果如下: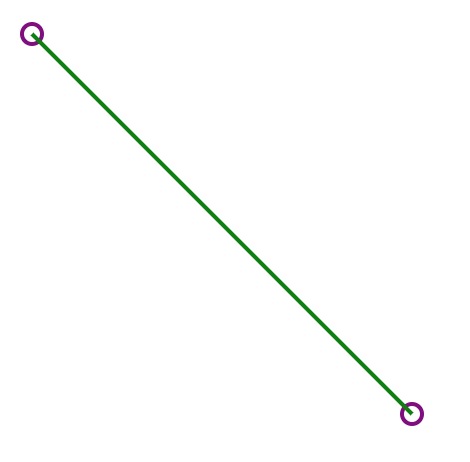
这段代码最关键的部分就是:
straightLineGroup.append('path').attr('d', 'M' + x1 + ',' + y1 + ' L' + x2 + ',' + y2)
d 属性描述了连线路径。
M x,y 在这里x和y是绝对坐标,分别代表水平坐标和垂直坐标。m dx,dy 在这里dx和dy是相对于当前点的距离,分别是向右和向下的距离。
和Moveto指令不同,Lineto指令将绘制一条直线段。这个直线段从当前位置移到指定位置。原生的Lineto命令的句法是”L x, y“或者”l dx, dy“,在这里x和y是绝对坐标,而dx和dy分别是向右和向下的距离。还有字母H和V,分别指定水平和垂直移动。它们的句法与L相同,它的小写版本是相对距离,大写版本是绝对位置。
2. 折线
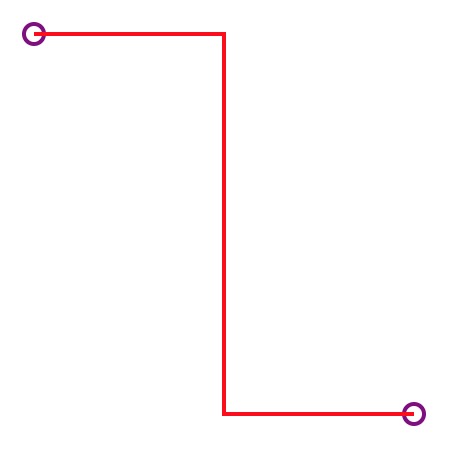
2.1 简单的折线
简单的折线有四个连接点,起点 ( x1, y1 ),第一个折线点: ( (x1+x2)/2, y1 ), 第二个折线点:( (x1+x2)/2, y2 ),终点:(x2, y2)
const polygonalLineGroup = svg.append('g');polygonalLineGroup.append('path').attr('d', 'M' + x1 + ',' + y1 + ' L' + (x1+x2)/2 + ',' + y1 + ' L' + (x1+x2)/2 + ',' + y2 + ' L' + x2 + ',' + y2).style('fill', 'none').style('stroke', 'red').style('stroke-width', 2);
效果如下:
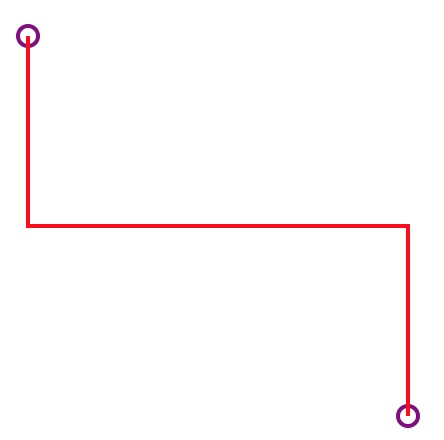
换个方向折
polygonalLineGroup.append('path').attr('d', 'M' + x1 + ',' + y1 + ' L' + x1 + ',' + (y1+y2)/2 + ' L' + x2 + ',' + (y1+y2)/2 + ' L' + x2 + ',' + y2).style('fill', 'none').style('stroke', 'red').style('stroke-width', 2);
给线条加个属性,让连接点圆滑一点
polygonalLineGroup.append('path')....style('stroke-linejoin', 'round')
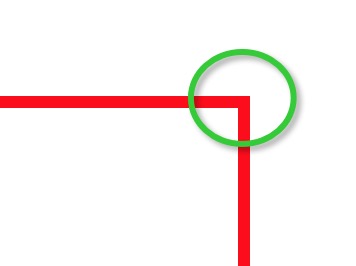 ============>
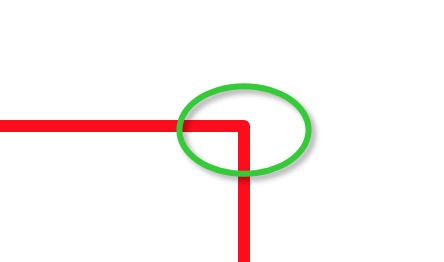
放大一点可以看到连接的直角变得圆滑了。
2.2 带弧度的折线
但是有时候,我们需要连接的角度是有弧度的,像这样:
要构造这样的线条需要先了解线条的弧形指令的使用:
A rx ry x-axis-rotation large-arc-flag sweep-flag x ya rx ry x-axis-rotation large-arc-flag sweep-flag dx dy
这个指令里面最需要理解的 large-arc-flag sweep-flag 这两个参数对弧形的影响:large-arc-flag(角度大小) 和sweep-flag(弧线方向),large-arc-flag决定弧线是大于还是小于180度,0表示小角度弧,1表示大角度弧。sweep-flag表示弧线的方向,0表示从起点到终点沿逆时针画弧,1表示从起点到终点沿顺时针画弧。下面的例子展示了这四种情况。
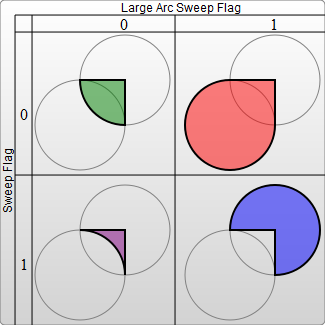
<?xml version="1.0" standalone="no"?><svg width="325px" height="325px" version="1.1" xmlns="http://www.w3.org/2000/svg"><path d="M80 80A 45 45, 0, 0, 0, 125 125L 125 80 Z" fill="green"/><path d="M230 80A 45 45, 0, 1, 0, 275 125L 275 80 Z" fill="red"/><path d="M80 230A 45 45, 0, 0, 1, 125 275L 125 230 Z" fill="purple"/><path d="M230 230A 45 45, 0, 1, 1, 275 275L 275 230 Z" fill="blue"/></svg>
如果想要好好理解一下路径的Arcto指令,请查看这篇文章:https://developer.mozilla.org/zh-CN/docs/Web/SVG/Tutorial/Paths
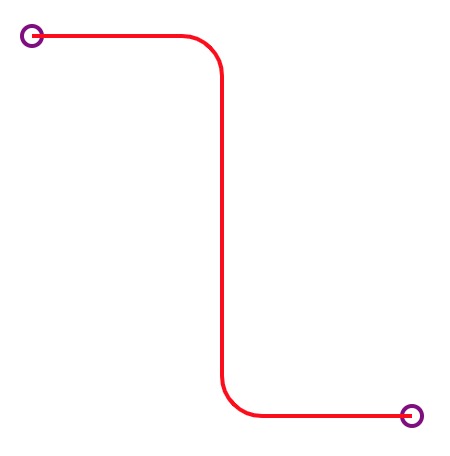
好了,接下来我们就开始画一条这样的折线:
// 水平折线路径构造器function hArcLineGenerater (x1, y1, x2, y2, radius) {return "M" + x1 + "," + y1+ "h" + ((x2-x1)/2 - radius)+ "a" + radius + "," + radius + " 0 0 1 " + radius + "," + radius+ "v" + (y2-y1-2*radius)+ "a" + radius + "," + radius + " 0 0 0 " + radius + "," + radius+ "L" + x2 + "," + y2;}// 绘制路径const radius = 20;polygonalLineGroup.append("path").attr("d", hArcLineGenerater(x1, y1, x2, y2, radius)).style('fill', 'none').style('stroke', 'red').style('stroke-width', 2);
这段代码的主要关键是路径生成函数 hArcLineGenerater 生成的折线路径。
效果如下:

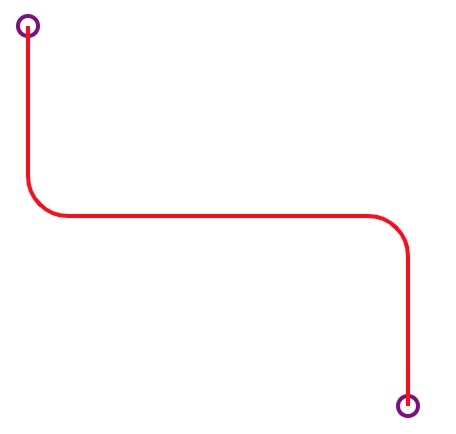
换个方向再折一下:
// 垂直折线路径构造器function vArcLineGenerater (x1, y1, x2, y2, radius) {return "M" + x1 + "," + y1+ "v" + ((y2-y1)/2 - radius)+ "a" + radius + "," + radius + " 0 0 0 " + radius + "," + radius+ "h" + (x2-x1-2*radius)+ "a" + radius + "," + radius + " 0 0 1 " + radius + "," + radius+ "L" + x2 + "," + y2}// 绘制路径const radius = 20;polygonalLineGroup.append("path").attr("d", vArcLineGenerater(x1, y1, x2, y2, radius)).style('fill', 'none').style('stroke', 'red').style('stroke-width', 2);
效果如下:
3. 贝塞尔曲线
贝塞尔曲线有个控制点的概念,具体可以看这里:https://developer.mozilla.org/zh-CN/docs/Web/SVG/Tutorial/Paths
以下二次贝塞尔曲线是基于 d3 绘制,非常简单,不需要自己构造路径算法。
3.1 二次贝塞尔曲线
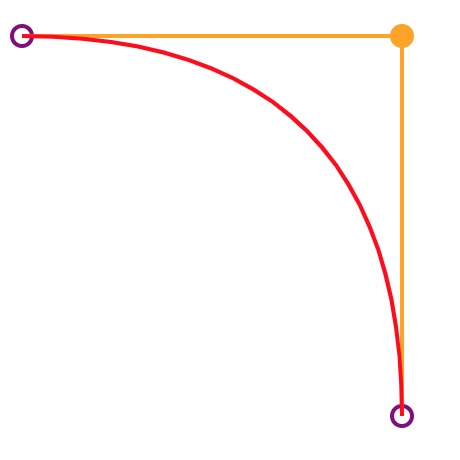
为了更方便观察,我绘制了控制点, 橘黄色的圆点为控制点
const dx = x1 - 10, dy = y2 - 10;const cpx1 = x1 - dx;const cpy1 = y1 + dy;const cpx2 = x2 + dx;const cpy2 = y2 - dy;const bezierLineGroup = svg.append('g');const path = d3.path();path.moveTo(x1, y1);// 二次贝塞尔曲线path.quadraticCurveTo(cpx2,cpy2,x2,y2);bezierLineGroup.append('path').attr('d', path.toString()).style('fill','none').style('stroke','red').style('stroke-width','2');
效果如下:
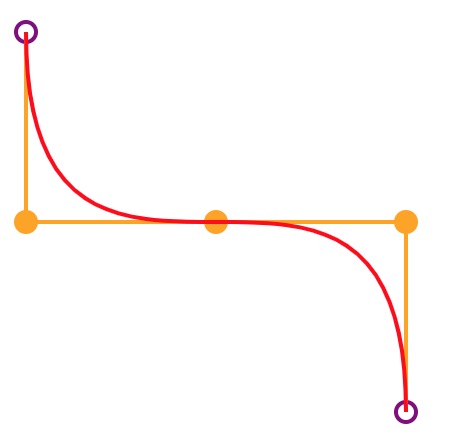
3.2 三次贝塞尔曲线
基于以上代码,只需要改动 二次贝塞尔曲线为三次贝塞尔曲线就可以了:
...// 二次贝塞尔曲线// path.quadraticCurveTo(cpx2,cpy2,x2,y2);// 三次贝塞尔曲线path.bezierCurveTo(cpx1,cpy1,cpx2,cpy2,x2,y2);...
效果如下:
小结
一根小小的线条,效果也有很多。在可视化世界里,组成很多图形的基础就是线条,打好基础,你才能得心应手地使用它来构建你的可视化世界。在贝塞尔曲线部分,我们偷懒直接使用了 D3 API 构造了曲线路径,你也可以尝试用自己的算法去画一条贝塞尔曲线,动手做起来。

若有收获,就点个赞吧
0 人点赞
