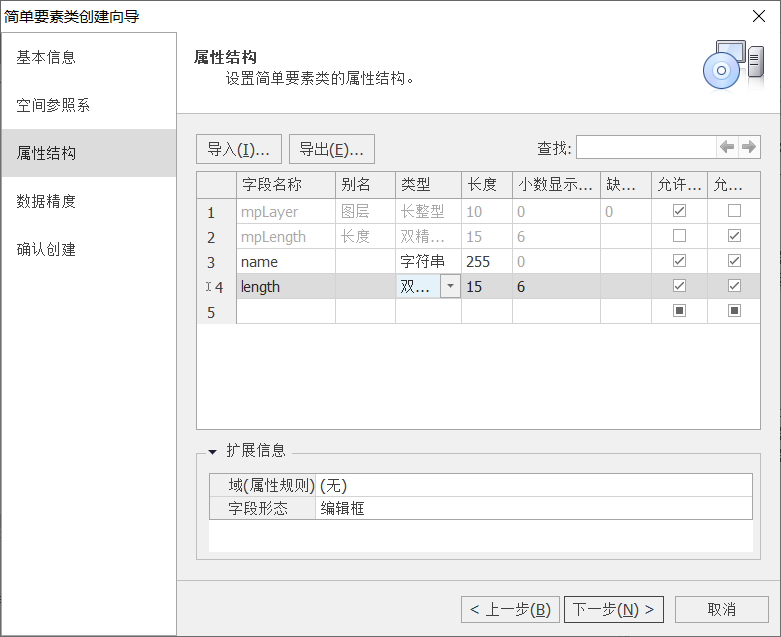
一、MapGIS创建线要素
设置name和length两个字段
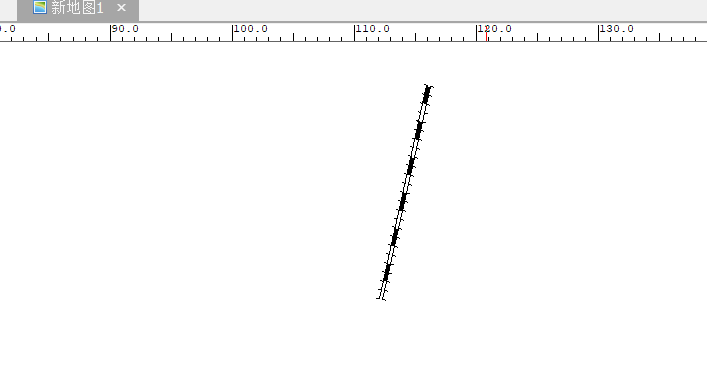
二、绘制从北京到广州的线 (铁路)
北京 (116.30 , 39.90)广州 (112.57 , 22.26)
之后点击开始的保存,然后在IG Server中重载一下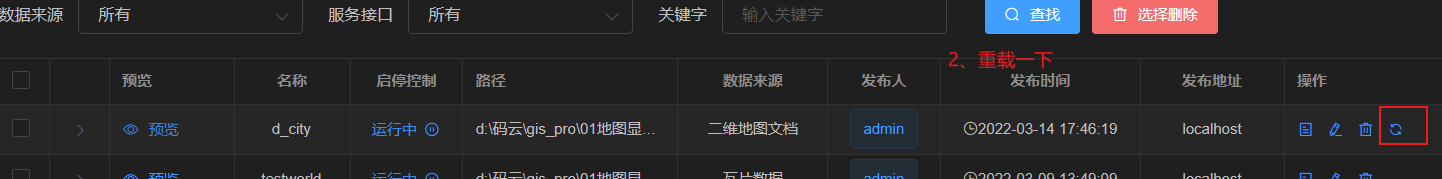
三、点击事件实现从武汉到成都的铁路
武汉 [114,30]成都 [104.07,30.67]
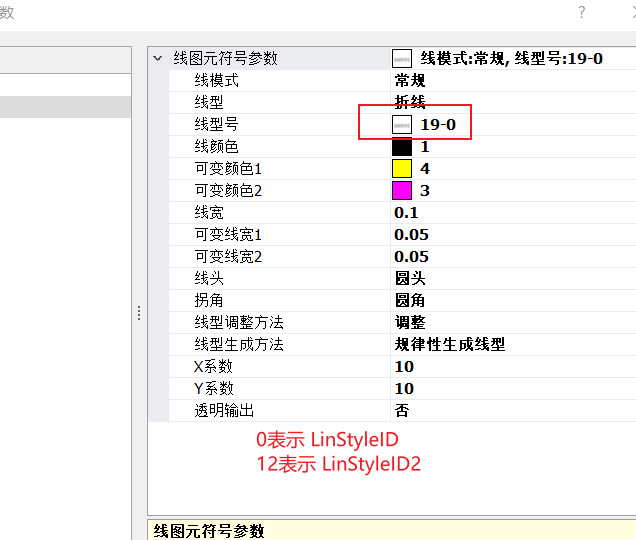
<!DOCTYPE html><html lang="en"><head><meta charset="UTF-8"><meta http-equiv="X-UA-Compatible" content="IE=edge"><meta name="viewport" content="width=device-width, initial-scale=1.0"><title>Document</title><!-- 1、加载ol库 --><script src="../lib/include-openlayers-local.js"></script><script src="../js/Gaode.js"></script></head><body><!-- 2、创建地图容器 --><button onclick="addLine()">添加</button><div id="map_container"></div><!-- 3、实例化对象 --><script>const docLayer = new Zondy.Map.Doc('', 'd_city', {ip: 'localhost',port: 6163})const map = new ol.Map({target: 'map_container',layers: [gaode, docLayer],view: new ol.View({projection: 'EPSG:4326',center: [114, 30],zoom: 4})})/* 添加一个线到数据库 */function addLine(){/* 2.1 构建几何信息 */var pointObj = []pointObj[0] = new Zondy.Object.Point2D(114,30);pointObj[1] = new Zondy.Object.Point2D(104.07,30.67);/* 构成折线的弧度 */var gArc = new Zondy.Object.Arc(pointObj);/* 构成线的折线 */var gAnyLine = new Zondy.Object.AnyLine([gArc])/* 设置线要素的几何信息 */var gLine = new Zondy.Object.GLine(gAnyLine)/* 设置要素的几何信息 */var fGeom = new Zondy.Object.FeatureGeometry({LinGeom:[gLine]})/* 2.2 设置而样式信息 *///设置添加线要素的图形参数信息var clineInfo = new Zondy.Object.CLineInfo({Color:1, //子图的颜色号LinStyleID:0,LinStyleID2:19,LinWidth:0.1, //线宽Xscale:10,Yscale:10})//设置要素的图形参数var graphicInfo = new Zondy.Object.WebGraphicsInfo({InfoType:2, //线LinInfo:clineInfo})/* 2.3 设置属性信息 */var attValue = ['武广线',1289]/* 2.4 构建要素类*///创建一个线要素var newFeature = new Zondy.Object.Feature({fGeom:fGeom,GraphicInfo:graphicInfo,AttValue:attValue})//设置要为线要素newFeature.setFType(2)/* 2.5 设置要素集 *///创建一个要素数据集var featureSet = new Zondy.Object.FeatureSet();//创建属性结构设置对象var cAttStruct = new Zondy.Object.CAttStruct({FldName:['name','length'],FldNumber:2,FldType:['string','double ']})//设置要素数据集的属性结构featureSet.AttStruct = cAttStruct;//将添加的线要素添加到属性数据集中featureSet.addFeature(newFeature);/* 2.6 调用地图编辑服务接口 *///创建一个地图编辑对象var editDocFeature = new Zondy.Service.EditDocFeature('d_city',0,{ip:'localhost',port:'6163'})editDocFeature.add(featureSet,onLineSuccess)}function onLineSuccess(data) {if (data.succeed) {alert('添加成功')docLayer.refresh(); //重新加载地图文档} else {alert('添加点要素失败')}}</script></body></html>

若有收获,就点个赞吧
0 人点赞
