Tips: var position = e.feature.getGeometry().getCoordinates()[0]; //此处数组一定要加下标0,不然会出很大的问题❗
一、封装 zd_docEdit_Polygon.js
const AREA_STYLE = {EndColor: 1,FillColor: 26,FillMode: 0,OutPenWidth: 1,OverMethod: 0,PatAngle: 1,PatColor: 1,PatHeight: 1,PatID: 27,PatWidth: 1}const HOST = 'localhost';const PORT = 6163;/*** @param {array} position 坐标是一个二维数据* @param {array} attr [{name,value,type}]* @param {object} service {name,layerId}*/class Polygon {static add({position,layer,attr,service}) {//[[x1,y1],[x2,y2]]/* 1、构建区要素 *///1-1、构建几何信息console.log(position)var pointObj = [];for (let item of position) {pointObj.push(new Zondy.Object.Point2D(item[0], item[1]))}//构成区要素的弧段var gArc = new Zondy.Object.Arc(pointObj);//构成区要素折线var gAnyLine = new Zondy.Object.AnyLine([gArc]);//构成区要素var gRegion = new Zondy.Object.GRegion([gAnyLine]);//构成区要素的几何信息var fGeom = new Zondy.Object.FeatureGeometry({RegGeom: [gRegion]})//1-2、设置图形参数信息//设置区要素的图形参数信息var cRegionInfo = new Zondy.Object.CRegionInfo(AREA_STYLE);//要素图形参数信息var graphicInfo = new Zondy.Object.WebGraphicsInfo({InfoType: 3,RegInfo: cRegionInfo});//1-3、设置区要素的属性信息var attValue = attr.map(item => item.value);//创建一个新的区要素var newFeature = new Zondy.Object.Feature({AttValue: attValue,fGeom: fGeom,GraphicInfo: graphicInfo});newFeature.setFType(3);/* 2、创建一个要素数据集 */var featureSet = new Zondy.Object.FeatureSet();var fldNumber = attr.length;var fldType = attr.map(item => item.type);var fldName = attr.map(item => item.name);var cAttValue = new Zondy.Object.CAttStruct({FldNumber: fldNumber,FldType: fldType,FldName: fldName});featureSet.AttStruct = cAttValue;featureSet.addFeature(newFeature);//创建一个图层编辑对象var editLayerFeature = new Zondy.Service.EditDocFeature(service.name, service.layerId, {ip: service.host || HOST,port: service.port || PORT})editLayerFeature.add(featureSet, this.onPloySuccess(layer), this.onError);}//添加区要素回调函数static onPloySuccess(layer) {return function (data) {if (data.succeed) {alert("添加区要素成功!");layer.refresh();} else {alert("添加区要素失败!");}}}static onError(error) {console.log(error);}}
二、例子
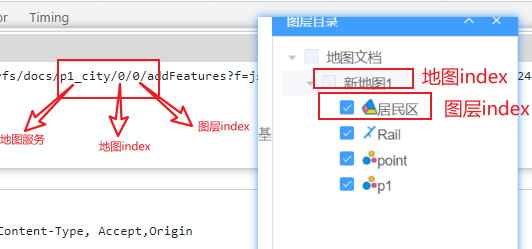
<!DOCTYPE html><html lang="en"><head><meta charset="UTF-8"><meta name="viewport" content="width=device-width, initial-scale=1.0"><title>Document</title><script src="./dist/include-openlayers-local.js"></script><script src="./js/TIAN.js"></script><script src="./js/Draw.js"></script><script src="./edit/es6_Polygon.js"></script></head><body><button onclick="activeDraw()">激活画笔</button><button onclick="exit()">退出画笔</button><div id="map_container"></div><script>var docLayer = new Zondy.Map.Doc('','city_area',{ip:'localhost',port:6163})var map = new ol.Map({target:"map_container",layers:[gaodeMapLayer,docLayer],view:new ol.View({projection:'EPSG:4326',center:[114.30,30.50],zoom:4})})/* 1、创建画布 */var source = new ol.source.Vector({wrapX:false});var layer = new ol.layer.Vector({source})map.addLayer(layer);/* 2、添加画笔 */let draw = null;function activeDraw(){draw = createDraw({type:"Polygon",source,callback:handleDraw})map.addInteraction(draw)}function handleDraw(e){var position = e.feature.getGeometry().getCoordinates()[0];var layer = docLayer;var attr = [{name:"name",value:"园区",type:"string"},{name:"area",value:1000,type:"long"},{name:"num",value:2000,type:"long"}]var service = {name:"city_area",layerId:0};Polygon.add({position,layer,attr,service})}function exit(){map.removeInteraction(draw);draw = null;}</script></body></html>

若有收获,就点个赞吧
0 人点赞
