创建 pod 对象并运行后,您可以通过从 API 读取 pod 对象来查看 pod 发生了什么。正如您在第 4 章中所了解的,pod 对象清单以及大多数其他类型的对象的清单都包含一个 status 部分。 pod 的 status 部分包含以下信息:
- Pod 的 IP 地址和托管它的工作节点
- Pod 的启动时间
- Pod 的服务质量 (QoS)
- Pod 处于哪个阶段
- Pod 的 conditions
- Pod 内各个容器的状态
IP 地址和开始时间不需要任何进一步解释,QoS 类现在不相关 - 你将在第 19 章中了解它。但是,Pod 的阶段和条件,以及容器的状态对于您了解 pod 生命周期很重要。
了解 pod 阶段
在 pod 生命的任何时刻,它都处于下图所示的五个阶段之一。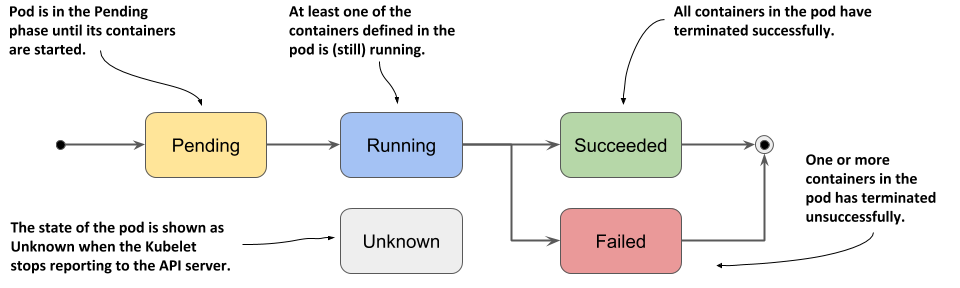
下表解释了每个阶段的含义。
| Pod Phase | Description |
|---|---|
| Pending | After you create the Pod object, this is its initial phase. Until the pod is scheduled to a node and the images of its containers are pulled and started, it remains in this phase. |
| Running | At least one of the pod’s containers is running. |
| Succeeded | Pods that aren’t intended to run indefinitely are marked as Succeeded when all their containers complete successfully. |
| Failed | When a pod is not configured to run indefinitely and at least one of its containers terminates unsuccessfully, the pod is marked as Failed. |
| Unknown | The state of the pod is unknown because the Kubelet has stopped reporting communicating with the API server. Possibly the worker node has failed or has disconnected from the network. |
pod 的阶段提供了关于 pod 正在发生的事情的快速摘要。让我们再次部署 kubia pod 并检查它的阶段。通过再次将 kubia.yaml 清单应用到您的集群来创建 pod,如上一章所述:
$ kubectl apply -f kubia.yaml
显示 pod 的阶段
pod 的阶段是 pod 对象状态部分中的字段之一。您可以通过显示其清单并可选地 grepping 输出来搜索该字段来查看它:
$ kubectl get po kubia -o yaml | grep phasephase: Running
还记得 jq 工具吗?您可以使用它来打印相位字段的值,如下所示:kubectl get po kubia -o json | jq .status.phase
您还可以使用 kubectl describe 查看 pod 的阶段。 pod 的状态显示在输出顶部附近。
$ kubectl describe po kubiaName: kubiaNamespace: default...Status: Running...
尽管 kubectl get pods 显示的 STATUS 列似乎也显示了阶段,但这仅适用于健康的 pod:
$ kubectl get po kubiaNAME READY STATUS RESTARTS AGEkubia 1/1 Running 0 40m
对于不健康的 Pod,STATUS 列指示 Pod 出了什么问题。您将在本章后面看到这一点。
了解 pod 的 conditions
pod 的阶段很少说明 pod 的状况。您可以通过查看 pod 的 conditions 来了解更多信息,就像您在第 4 章中对节点对象所做的那样。pod 的 conditions 表明 pod 是否已达到某个状态,以及为什么会这样。
与阶段相反,一个 pod 同时具有多个 conditions。在撰写本文时,已知四种条件类型。下表对它们进行了说明。
| Pod Condition | Description |
|---|---|
| PodScheduled | Indicates whether or not the pod has been scheduled to a node. |
| Initialized | The pod’s init containers have all completed successfully. |
| ContainersReady | All containers in the pod indicate that they are ready. This is a necessary but not sufficient condition for the entire pod to be ready. |
| Ready | The pod is ready to provide services to its clients. The containers in the pod and the pod’s readiness gates are all reporting that they are ready. Note: this is explained in chapter 10. |
每个条件要么满足,要么不满足。正如您在下图中看到的,PodScheduled 和 Initialized 条件一开始是未满足的,但很快就会满足,并在 pod 的整个生命周期中保持这种状态。相比之下,Ready 和 ContainersReady 条件可以在 pod 的生命周期内多次更改。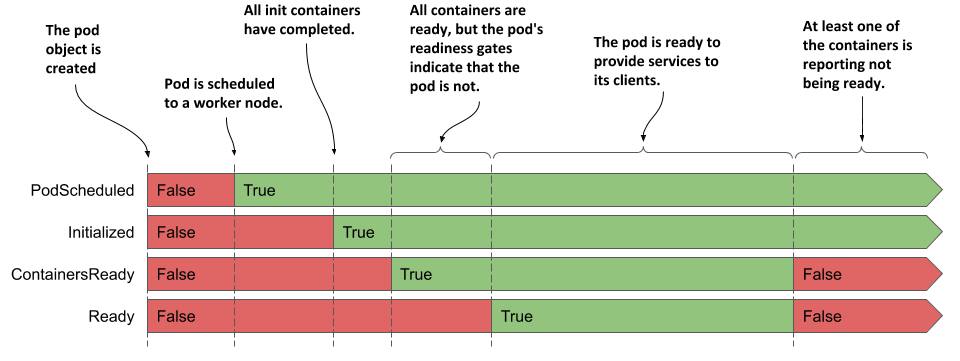
您还记得可以在节点对象中找到的条件吗?它们是 MemoryPressure、DiskPressure、PIDPressure 和 Ready。如您所见,每个对象都有自己的一组条件类型,但许多都包含通用的 Ready 条件,通常指示对象是否一切正常。
检查 pod 的conditions
要查看 pod 的条件,您可以使用 kubectl describe,如下面的清单所示:
$ kubectl describe po kubia | grep Conditions: -A5Conditions:Type StatusInitialized True #AReady True #BContainersReady True #BPodScheduled True #C
kubectl describe 命令仅显示每个条件是否为真。要找出条件为假的原因,您必须检查 pod 清单,如下面的清单所示。
$ kubectl get po kubia -o json | jq .status.conditions[{"lastProbeTime": null,"lastTransitionTime": "2020-02-02T11:42:59Z","status": "True","type": "Initialized"},
每个条件都有一个状态字段,指示条件是 True、False 还是 Unknown。对于 kubia pod,所有条件的状态都是 True,这意味着它们都已满足。codition 包含一个 reason 字段,指定上一次状态转变的原因(面向机器的),并且包含一个 message 字段,用于更加详细的说明。 lastTransitionTime 字段显示更改发生的时间,而 lastProbeTime 指示上次检查此条件的时间。
了解容器的状态
pod 的状态中还包含每个容器的状态。检查状态可以更好地了解每个容器的操作。
状态包含几个字段。 state 字段指示容器的当前状态,而 lastState 字段显示前一个容器终止后的状态。容器状态还表示容器的内部ID(containerID)、容器正在运行的镜像和镜像ID、容器是否准备好以及重启的频率(restartCount)。
了解容器状态
容器状态最重要的部分是它的状态。容器可以处于下图所示的状态之一。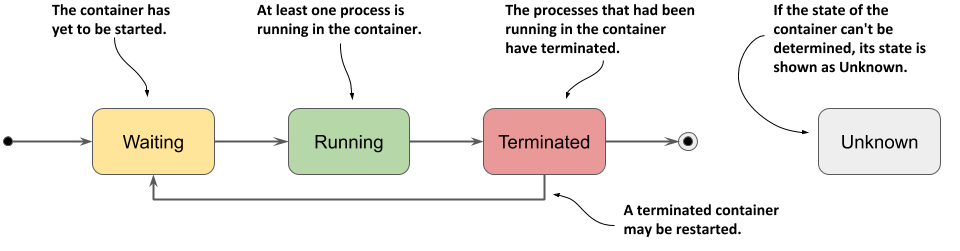
| Container State | Description |
|---|---|
| Waiting | The container is waiting to be started. The reason and message fields indicate why the container is in this state. |
| Running | The container has been created and processes are running in it. The startedAt field indicates the time at which this container was started. |
| Terminated | The processes that had been running in the container have terminated. The startedAt and finishedAt fields indicate when the container was started and when it terminated. The exit code with which the main process terminated is in the exitCode field. |
| Unknown | The state of the container couldn’t be determined. |
显示 pod 容器的状态
kubectl get pods 显示的 pod 列表仅显示每个 pod 中的容器数量以及其中准备就绪的容器数量。要查看单个容器的状态,您必须使用 kubectl describe,如下面的清单所示。
$ kubectl describe po kubia | grep Containers: -A15Containers:kubia:Container ID: docker://c64944a684d57faacfced0be1af44686...Image: luksa/kubia:1.0Image ID: docker-pullable://luksa/kubia@sha256:3f28...Port: 8080/TCPHost Port: 0/TCPState: Running #AStarted: Sun, 02 Feb 2020 12:43:03 +0100 #AReady: True #BRestart Count: 0 #CEnvironment: <none>Mounts:...
关注清单中带注释的行,因为它们表明容器是否健康。 kubia 容器正在运行并准备就绪。它从未重新启动过。
您还可以使用 jq 显示容器状态,如下所示:kubectl get po kubia -o json | jq .status.containerStatuses
检查 init 容器的状态
在上一章中,您了解到除了常规容器之外,Pod 还可以具有在 Pod 启动时运行的 init 容器。与常规容器一样,这些容器的状态在 pod 对象清单的状态部分中可用,但在 initContainerStatuses 字段中。
作为一个额外的练习,您可以自己尝试,创建在上一章的 kubia-init.yaml 文件中定义的 pod,并使用 kubectl describe 和检索它的两个常规容器和两个初始化容器的阶段、条件和状态pod manifest 使用 kubectl get po kubia-init -o json | jq .status 命令。

若有收获,就点个赞吧
0 人点赞
