集群运行状态为 Yellow
在导入一个生产数据进 Elasticsearch 后,发现该生产数据索引的运行状态为 yello。
Elasticsearch 对索引运行状态为 yellow 解释为:
所有的主分片已经分片了,但至少还有一个副本是缺失的。不会有数据丢失,所以搜索结果依然是完整的。不过,你的高可用性在某种程度上被弱化。如果 更多的 分片消失,你就会丢数据了。把
yellow想象成一个需要及时调查的警告。
https://www.elastic.co/guide/cn/elasticsearch/guide/current/_cluster_health.html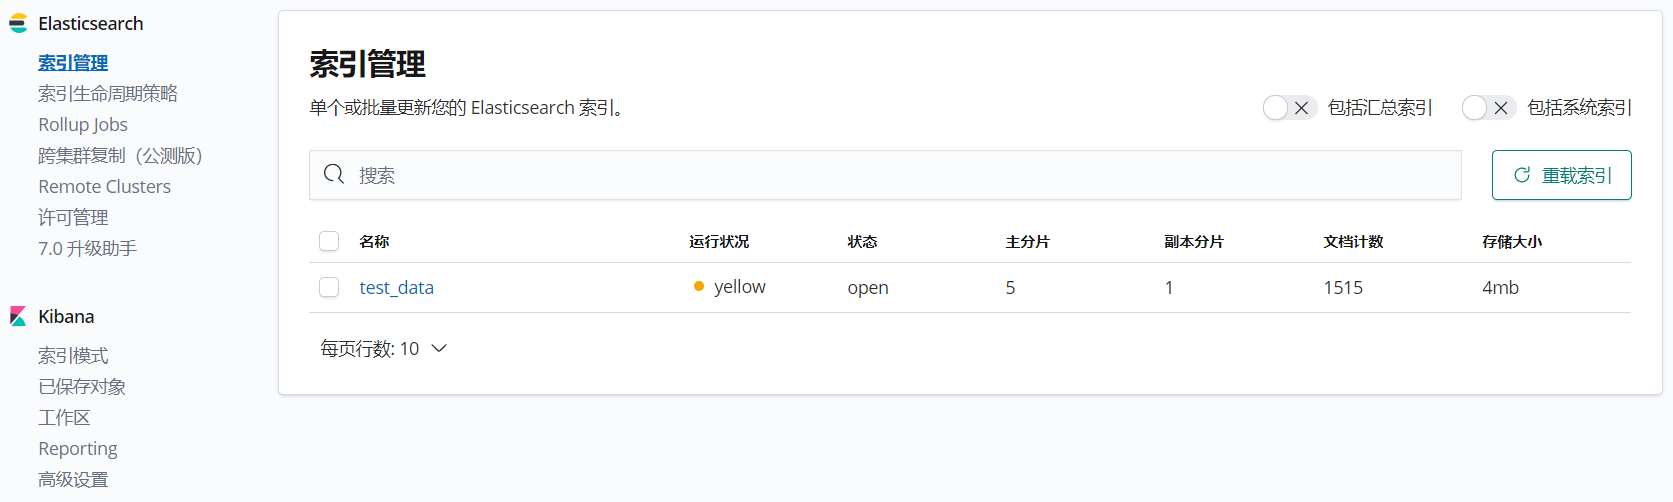
查询集群的健康状况
http://127.0.0.1:9200/_cat/indices你的 Elasticsearch 服务地址:端口号/_cat/indices
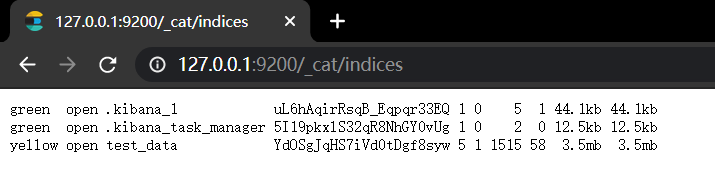
其中的 .kibana_1,.kibana_task_manager,均是程序自带集群,剩下的就是用户导入的集群。
在这里,集群运行状态显示了 yellow,不同于前两个的 green。
查看详细的异常提示信息
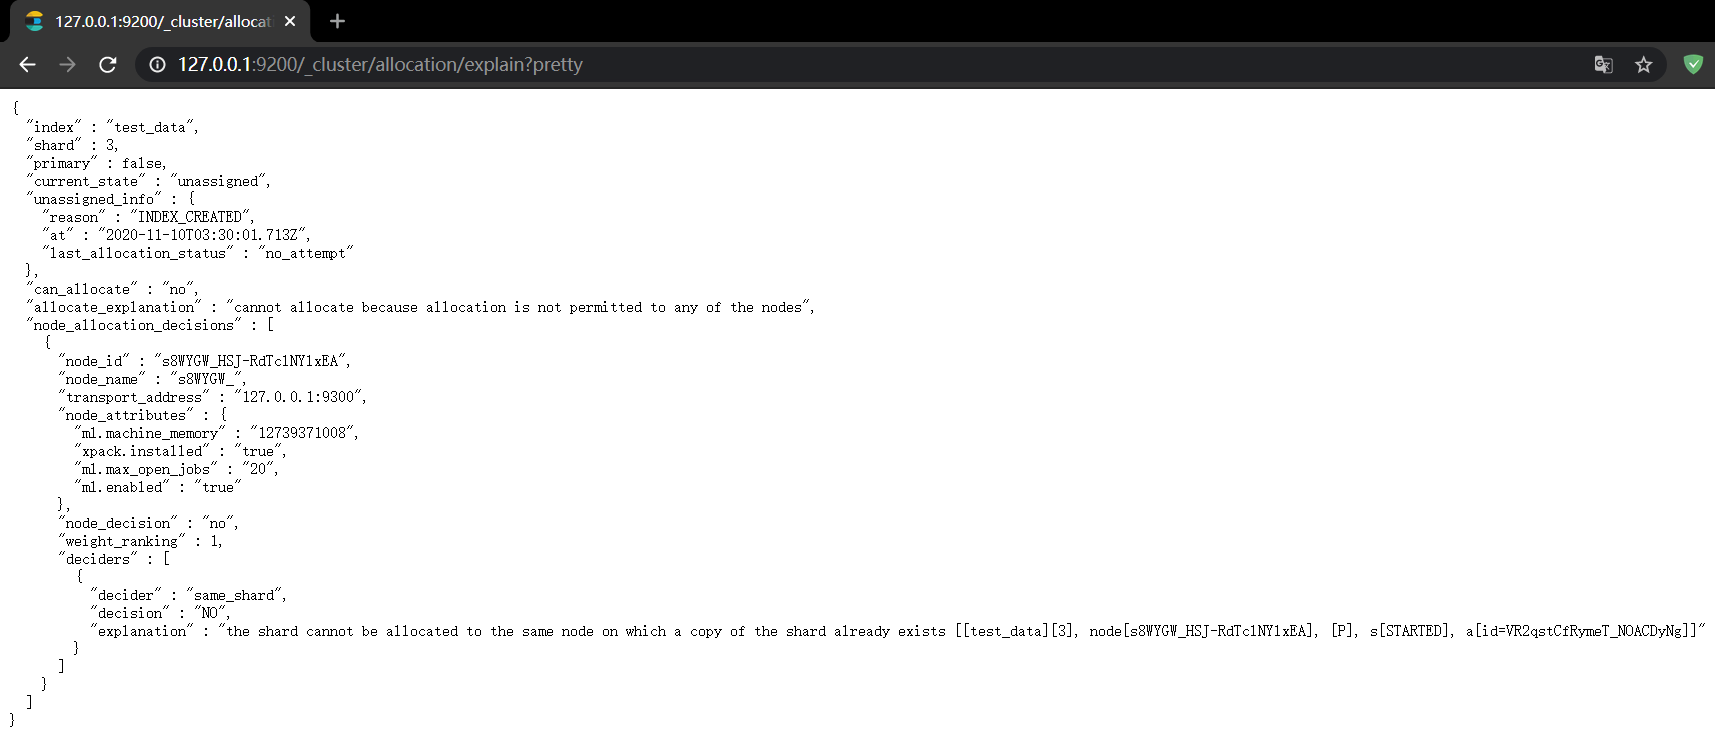
http://127.0.0.1:9200/_cluster/allocation/explain?pretty
解决方案
cannot allocate because allocation is not permitted to any of the nodes
allocate_explanation: "cannot allocate because allocation is not permitted to any of the nodes"分配的解释:无法分配,因为不允许对任何节点进行分配
可视化的解决方案:在 Kibana 中对该集群索引进行配置:
将其中的"index.number_of_replicas" 值由 "1" 改为 "0" 。保存后即可生效,无需重启 Elasticsearch。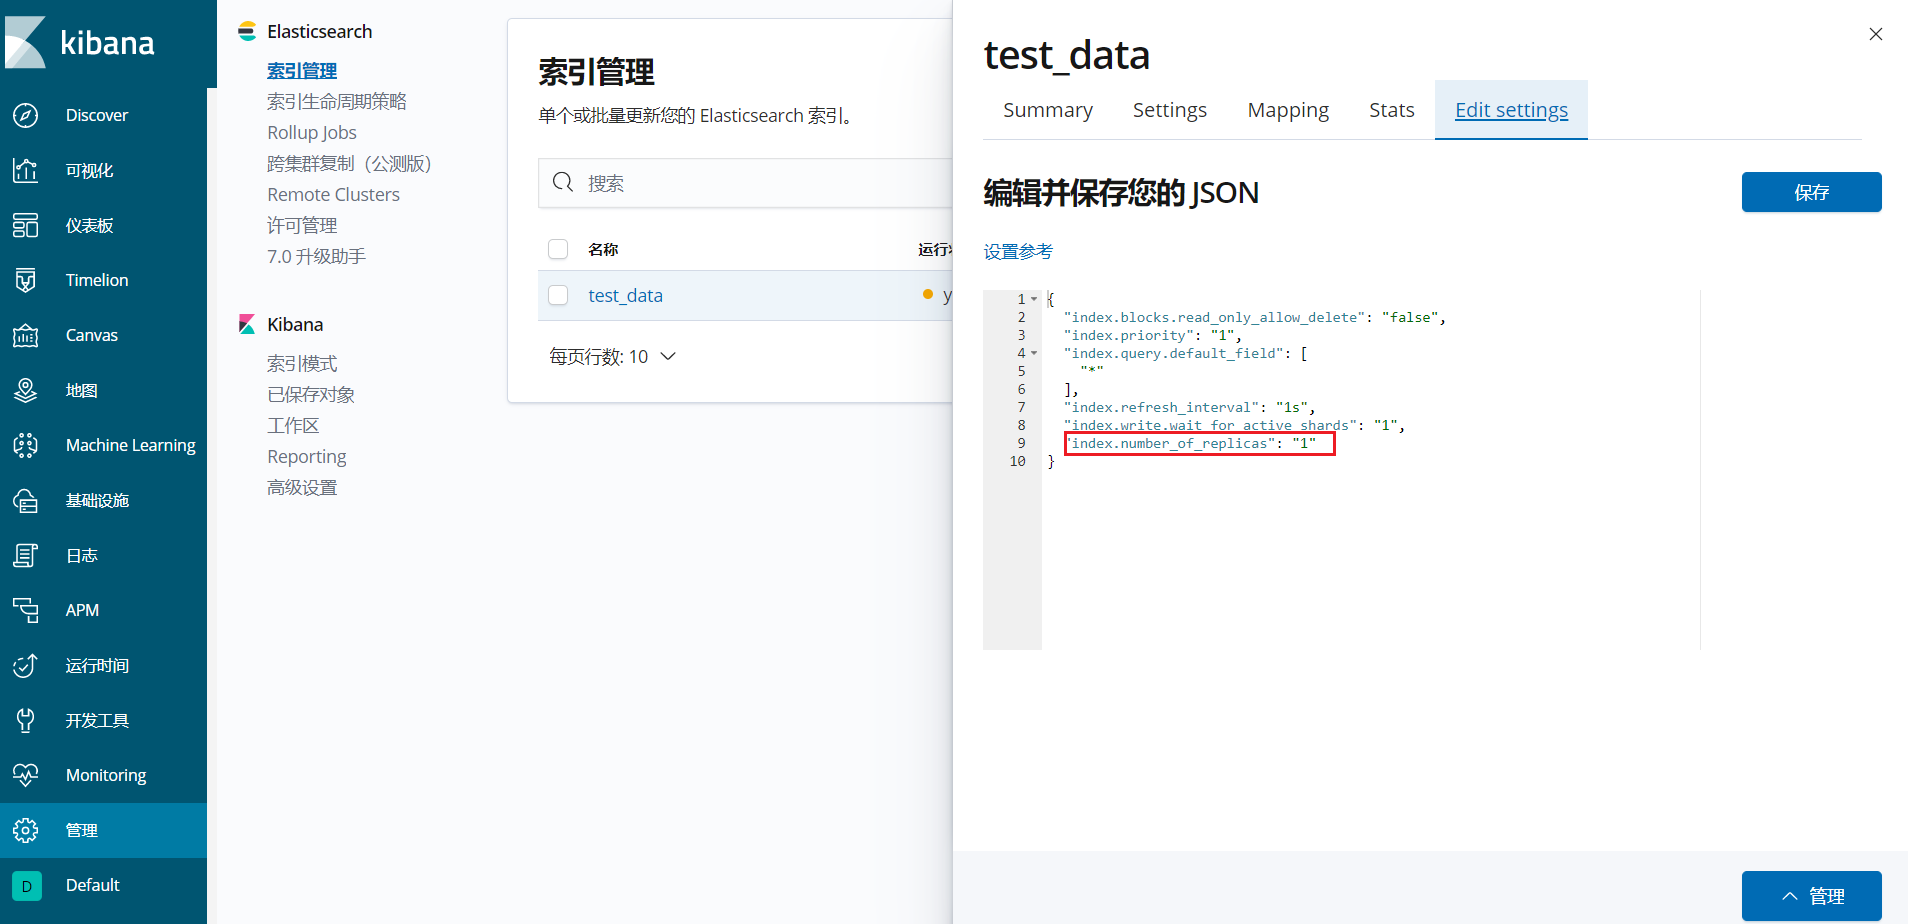
修改后: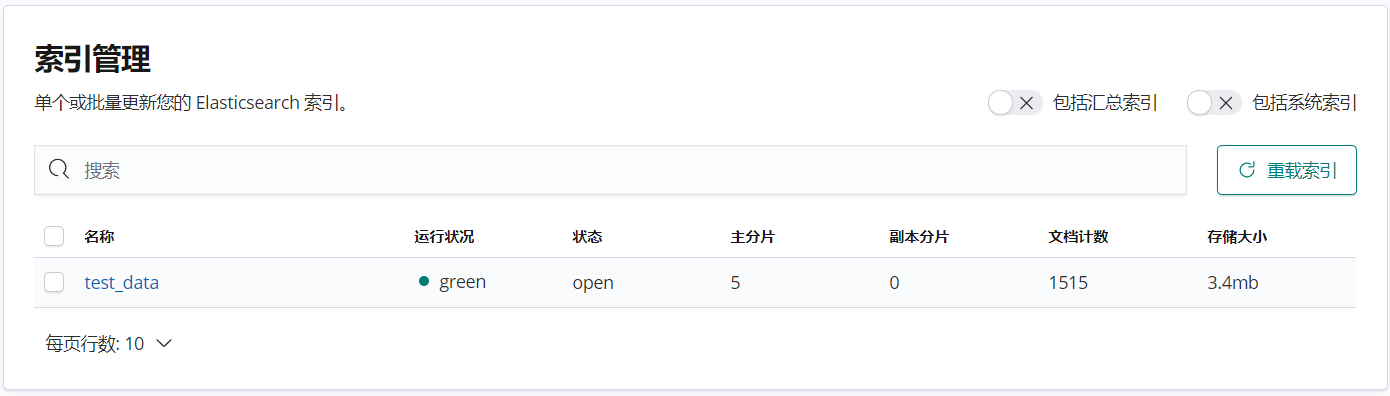
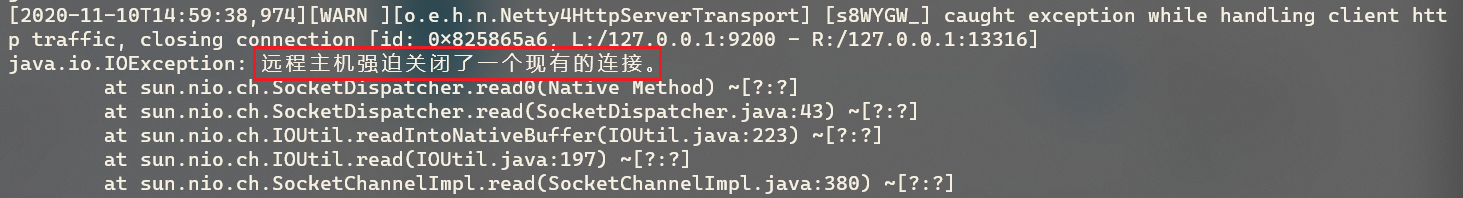
终端中文字符显示异常
Elasticsearch 的 “./config” 路径下的 jvm.options 文件,修改如下配置项
将 -Dfile.encoding 的值由 UTF-8 改为GBK
修改查询返回的最大条数
在 Elasticsearch 中做分页查询,默认的只有 10000 条。有时候这不满足我们查询的需求,所以我们需要找到这个默认值并修改。
Elasticsearch 中由 index.max._result_window 控制查询返回条数上限。
暂时未找到通过图形化的方式去设置该属性值,仅找到通过 Elasticsearch API 的方式去设置新的最大返回条数

若有收获,就点个赞吧
0 人点赞
