- 9.1 安装 filebeat
- 9.2 连接 Elastic Stack
- ================================== Outputs ===================================
- Configure what output to use when sending the data collected by the beat.
- —————————————— Elasticsearch Output ——————————————
- Array of hosts to connect to.
- Protocol - either
http(default) orhttps. - protocol: “https”
- Authentication credentials - either API key or username/password.
- api_key: “id:api_key”
- ============================== Filebeat inputs ===============================
- Each - is an input. Most options can be set at the input level, so
- you can use different inputs for various configurations.
- Below are the input specific configurations.
- filestream is an input for collecting log messages from files.
- Unique ID among all inputs, an ID is required.
- Change to true to enable this input configuration.
- Paths that should be crawled and fetched. Glob based paths.
- - /var/log/*.log
- Exclude lines. A list of regular expressions to match. It drops the lines that are
- matching any regular expression from the list.
- exclude_lines: [‘^DBG’]
- Include lines. A list of regular expressions to match. It exports the lines that are
- matching any regular expression from the list.
- include_lines: [‘^ERR’, ‘^WARN’]
- Exclude files. A list of regular expressions to match. Filebeat drops the files that
- are matching any regular expression from the list. By default, no files are dropped.
- prospector.scanner.exclude_files: [‘.gz$’]
- Optional additional fields. These fields can be freely picked
- to add additional information to the crawled log files for filtering
- fields:
- level: debug
- review: 1
- 9.3 启用和配置指标收集模块
- Module: elasticsearch
- https://www.elastic.co/guide/en/beats/filebeat/8.2/filebeat-module-elasticsearch.html">Docs: https://www.elastic.co/guide/en/beats/filebeat/8.2/filebeat-module-elasticsearch.html
- Server log
- Set custom paths for the log files. If left empty,
- Filebeat will choose the paths depending on your OS.
- Set custom paths for the log files. If left empty,
- Filebeat will choose the paths depending on your OS.
- Set custom paths for the log files. If left empty,
- Filebeat will choose the paths depending on your OS.
- Set custom paths for the log files. If left empty,
- Filebeat will choose the paths depending on your OS.
- Set custom paths for the log files. If left empty,
- Filebeat will choose the paths depending on your OS.
- 9.5 启动 filebeat
9.1 安装 filebeat
- 下载 filebeat
https://www.elastic.co/cn/downloads/beats/filebeat,下载 zip 版本
解压 zip 包,以管理员身份启动 PowerShell,进入目录,输入以下命令将 Filebeat 注册为 windows 服务
.\install-service-filebeat.ps1

如果在系统上禁用了脚本执行,则需要为当前会话设置执行策略以允许脚本运行。例如:PowerShell.exe -ExecutionPolicy UnRestricted -File .\install-service-filebeat.ps1.
9.2 连接 Elastic Stack
打开 filebeat.yml,设置连接 elasticsearch 相关配置,当您首次启动 Elasticsearch 时,默认情况下会启用 Elasticsearch 的网络加密(TLS)等安全功能。如果您使用的是 Elasticsearch 首次启动时生成的自签名证书,则需要在此处添加其指纹。指纹打印在 Elasticsearch 启动日志上。 ```yaml
================================== Outputs ===================================
Configure what output to use when sending the data collected by the beat.
—————————————— Elasticsearch Output ——————————————
output.elasticsearch:
Array of hosts to connect to.
hosts: [“https://172.18.1.31:1001","https://172.18.1.31:1002","https://172.18.1.31:1003“]
Protocol - either http (default) or https.
protocol: “https”
Authentication credentials - either API key or username/password.
api_key: “id:api_key”
username: “elastic” password: “5_QD9o4D-VZn0dUJDO=c” ssl: enabled: true ca_trusted_fingerprint: “22e8f9824c14c392fe403fe81f4a21790ce1026eebca02bb0a348c4038884483”
2. 设置连接 kibana 相关配置```yaml# =================================== Kibana ===================================# Starting with Beats version 6.0.0, the dashboards are loaded via the Kibana API.# This requires a Kibana endpoint configuration.setup.kibana:# Kibana Host# Scheme and port can be left out and will be set to the default (http and 5601)# In case you specify and additional path, the scheme is required: http://localhost:5601/path# IPv6 addresses should always be defined as: https://[2001:db8::1]:5601host: "172.18.1.31:5601"username: "elastic"password: "5_QD9o4D-VZn0dUJDO=c"# Kibana Space ID# ID of the Kibana Space into which the dashboards should be loaded. By default,# the Default Space will be used.#space.id:
filebeat.inputs:
Each - is an input. Most options can be set at the input level, so
you can use different inputs for various configurations.
Below are the input specific configurations.
filestream is an input for collecting log messages from files.
type: filestream
Unique ID among all inputs, an ID is required.
id: my-filestream-id
Change to true to enable this input configuration.
enabled: true
Paths that should be crawled and fetched. Glob based paths.
paths:
- /var/log/*.log
- c:\programdata\elasticsearch\logs*
Exclude lines. A list of regular expressions to match. It drops the lines that are
matching any regular expression from the list.
exclude_lines: [‘^DBG’]
Include lines. A list of regular expressions to match. It exports the lines that are
matching any regular expression from the list.
include_lines: [‘^ERR’, ‘^WARN’]
Exclude files. A list of regular expressions to match. Filebeat drops the files that
are matching any regular expression from the list. By default, no files are dropped.
prospector.scanner.exclude_files: [‘.gz$’]
Optional additional fields. These fields can be freely picked
to add additional information to the crawled log files for filtering
fields:
level: debug
review: 1
9.3 启用和配置指标收集模块
确定需要启用的模块。要查看可用模块的列表,请运行:
.\filebeat.exe modules list
启用 elasticsearch 模块,启动后,目录 modules.d 中的 elasticsearch.yml 后缀 disable会自行取消,变得可以配置
.\filebeat.exe modules enable elasticsearch
修改 elasticsearch.yml ```yaml
Module: elasticsearch
Docs: https://www.elastic.co/guide/en/beats/filebeat/8.2/filebeat-module-elasticsearch.html
module: elasticsearch
Server log
server: enabled: true
Set custom paths for the log files. If left empty,
Filebeat will choose the paths depending on your OS.
var.paths:
- D:\elasticsearch-cluster\node-1001\logs\*_server.json- D:\elasticsearch-cluster\node-1002\logs\*_server.json- D:\elasticsearch-cluster\node-1003\logs\*_server.json
gc: enabled: true
Set custom paths for the log files. If left empty,
Filebeat will choose the paths depending on your OS.
var.paths:
- D:\elasticsearch-cluster\node-1001\logs\gc.log.[0-9]*
- D:\elasticsearch-cluster\node-1002\logs\gc.log.[0-9]*
- D:\elasticsearch-cluster\node-1003\logs\gc.log.[0-9]*
audit: enabled: true
Set custom paths for the log files. If left empty,
Filebeat will choose the paths depending on your OS.
var.paths:
- D:\elasticsearch-cluster\node-1001\logs*_audit.json
- D:\elasticsearch-cluster\node-1002\logs*_audit.json
- D:\elasticsearch-cluster\node-1003\logs*_audit.json
slowlog: enabled: true
Set custom paths for the log files. If left empty,
Filebeat will choose the paths depending on your OS.
var.paths:
- D:\elasticsearch-cluster\node-1001\logs*_index_search_slowlog.json
- D:\elasticsearch-cluster\node-1001\logs*_index_indexing_slowlog.json
- D:\elasticsearch-cluster\node-1002\logs*_index_search_slowlog.json
- D:\elasticsearch-cluster\node-1002\logs*_index_indexing_slowlog.json
- D:\elasticsearch-cluster\node-1003\logs*_index_search_slowlog.json
- D:\elasticsearch-cluster\node-1003\logs*_index_indexing_slowlog.json
deprecation: enabled: true
Set custom paths for the log files. If left empty,
Filebeat will choose the paths depending on your OS.
var.paths:
- D:\elasticsearch-cluster\node-1001\logs*_deprecation.json
- D:\elasticsearch-cluster\node-1002\logs*_deprecation.json
- D:\elasticsearch-cluster\node-1003\logs*_deprecation.json
-e 的含义:日志直接命令行输出,而非日志。<a name="oY1aZ"></a># 9.4 加载索引模板供 Kibana 可视化在 kibana 运行的情况下,从安装目录中,运行:```bash.\filebeat.exe setup -e
9.5 启动 filebeat
等上一步执行成功后,再启动 filebeat
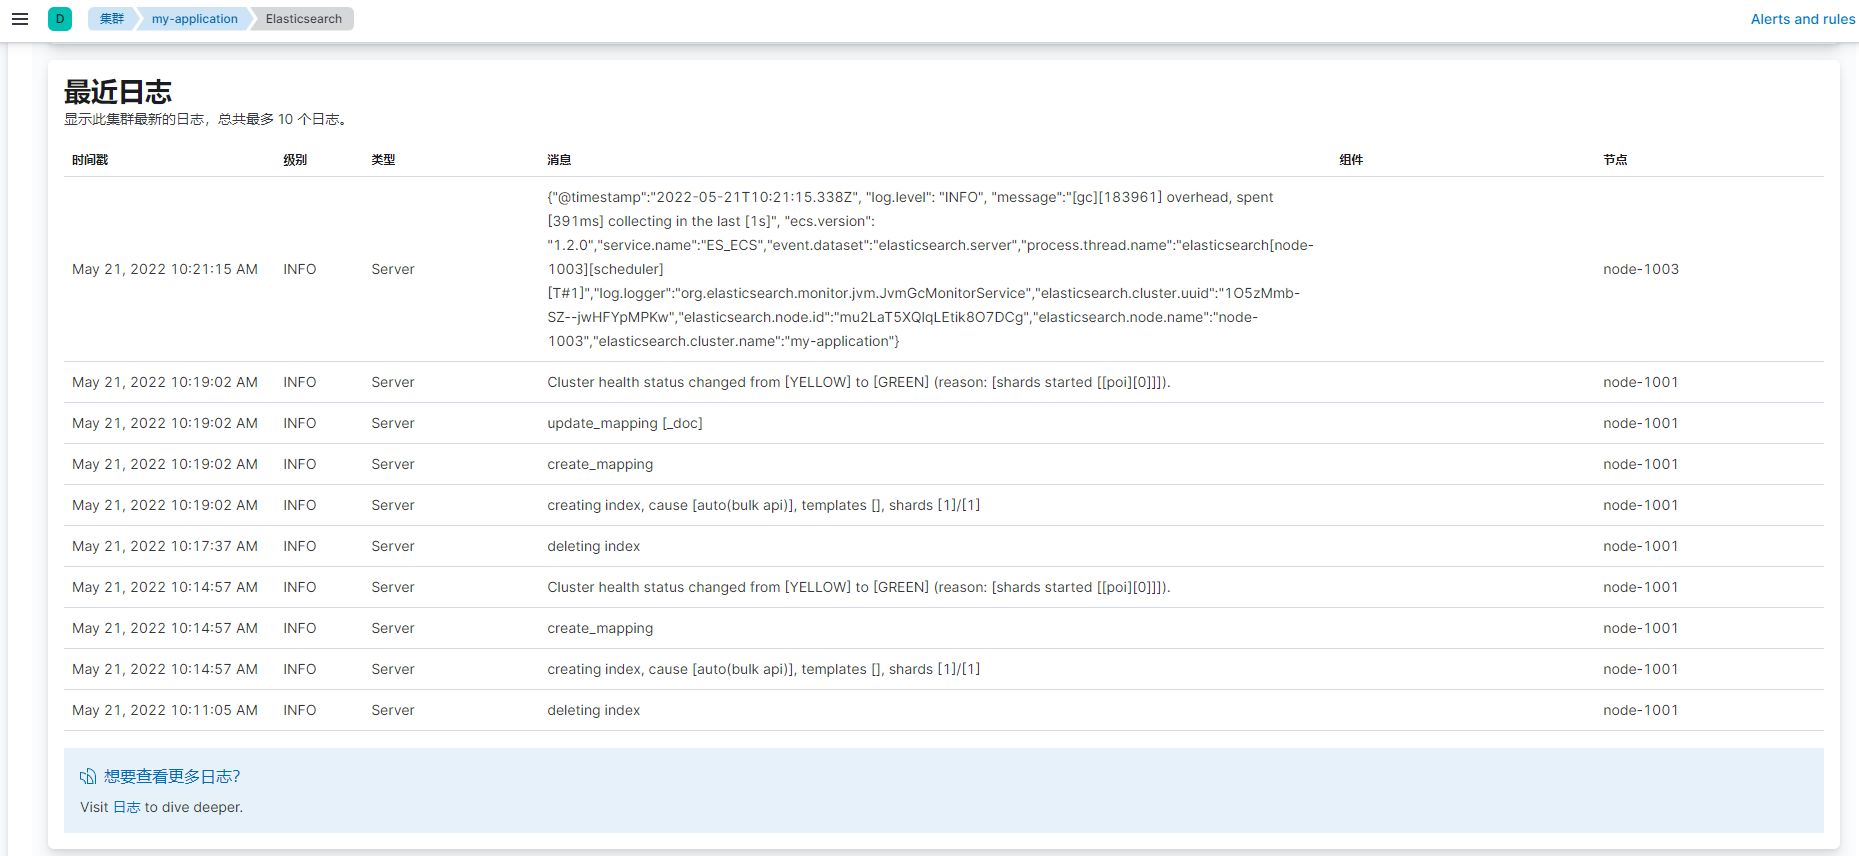
至此,整个 filebeat 就全部配置完毕,登录 kibana,选择“堆栈监测”,看到所有节点的日志.\filebeat.exe -e


【注意】
- 以上演示为在集群状态下,一台物理机部署三个节点的情况,如果在多台物理机部署,则需要在每个节点部署一个 filebeat,分别连接各自对应的节点即可
- 启动成功后,下次可以从 windows 服务启动和关闭 filebeat
- 默认情况下,Windows 日志文件存储在 C:\ProgramData\filebeat\Logs 中

若有收获,就点个赞吧
0 人点赞
