Debug 地址
为了安全起见,Debug 地址在 -env=pro 时,不可访问!
示例
查看 CPU 信息
// 查看 CPU 信息$ go tool pprof 127.0.0.1:9999/debug/pprof/profile// 系统会收集 30s 内的请求,然后输出下面:Fetching profile over HTTP from http://127.0.0.1:9999/debug/pprof/profileSaved profile in /Users/xinliang/pprof/pprof.samples.cpu.001.pb.gzType: cpuTime: Jan 23, 2021 at 3:25pm (CST)Duration: 30.01s, Total samples = 0No samples were found with the default sample value type.Try "sample_index" command to analyze different sample values.Entering interactive mode (type "help" for commands, "o" for options)(pprof)//输入 web,生成 svg 文件。//输入 png,生成 png 文件。//输入 top,查看排名前 20 的信息。//查看更多命令,请执行 pprof help。
查看其他同上
// 查看 内存 信息$ go tool pprof 127.0.0.1:9999/debug/pprof/heap// 查看 协程 信息$ go tool pprof 127.0.0.1:9999/debug/pprof/goroutine// 查看 锁 信息$ go tool pprof 127.0.0.1:9999/debug/pprof/mutex
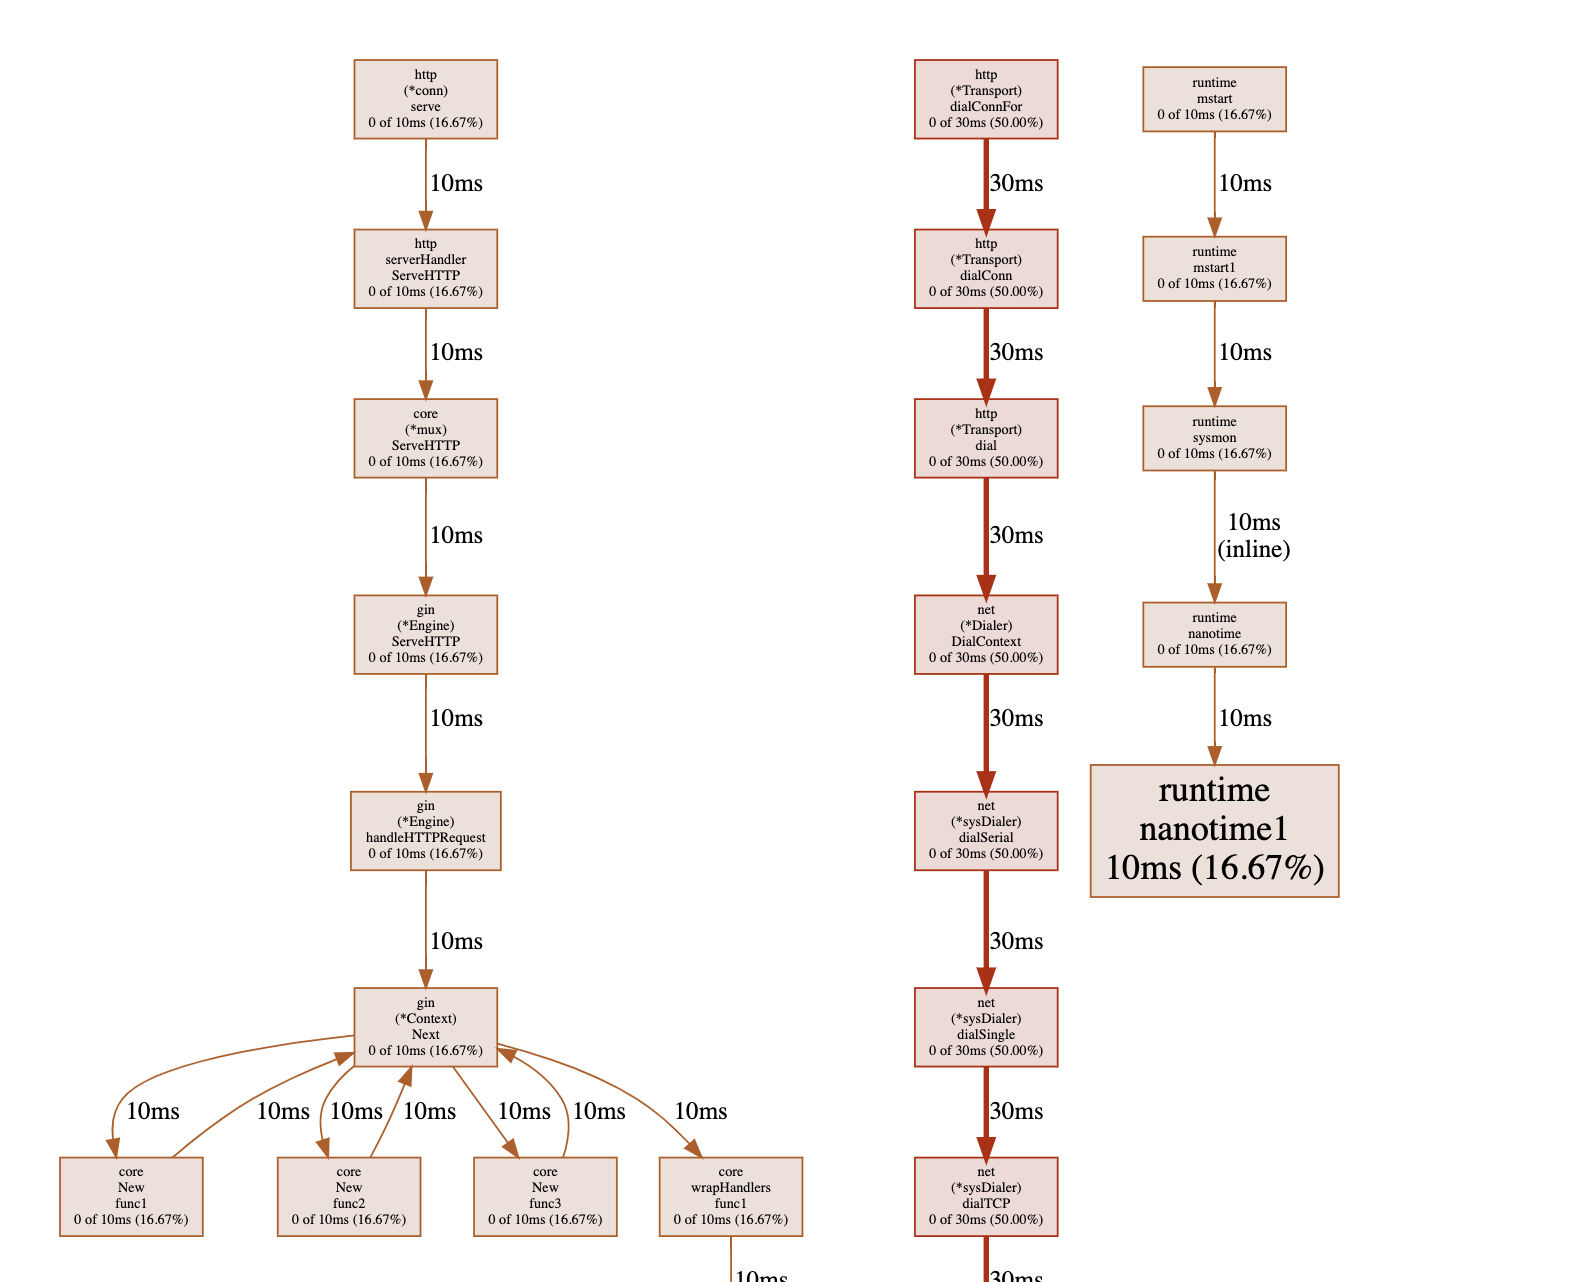
查看火焰图 🔥
// 1.下载 pprof 工具$ go get -u github.com/google/pprof// 2.启动可视化界面$ pprof -http=:9998 xxx.pb.gz// 3.查看可视化界面http://127.0.0.1:9998/ui/

若有收获,就点个赞吧
0 人点赞
