一、Prometheus简介
Prometheus 是由 SoundCloud 开发的开源监控报警系统和时序列数据库(TSDB)。Prometheus 使用 Go 语言开发,是 Google BorgMon 监控系统的开源版本。
2016 年由 Google 发起 Linux 基金会旗下的原生云基金会(Cloud Native Computing Foundation), 将 Prometheus 纳入其下第二大开源项目。
Prometheus 目前在开源社区相当活跃。
Prometheus 和 Heapster (Heapster 是 K8S 的一个子项目,用于获取集群的性能数据。) 相比功能更完善、更全面。Prometheus 性能也足够支撑上万台规模的集群。
Prometheus的特点
- 多维度数据模型。
- 灵活的查询语言。
- 不依赖分布式存储,单个服务器节点是自主的。
- 通过基于 HTTP 的 pull 方式采集时序数据。
- 可以通过中间网关进行时序列数据推送。
- 通过服务发现或者静态配置来发现目标服务对象。
- 支持多种多样的图表和界面展示,比如 Grafana 等。
Prometheus架构图

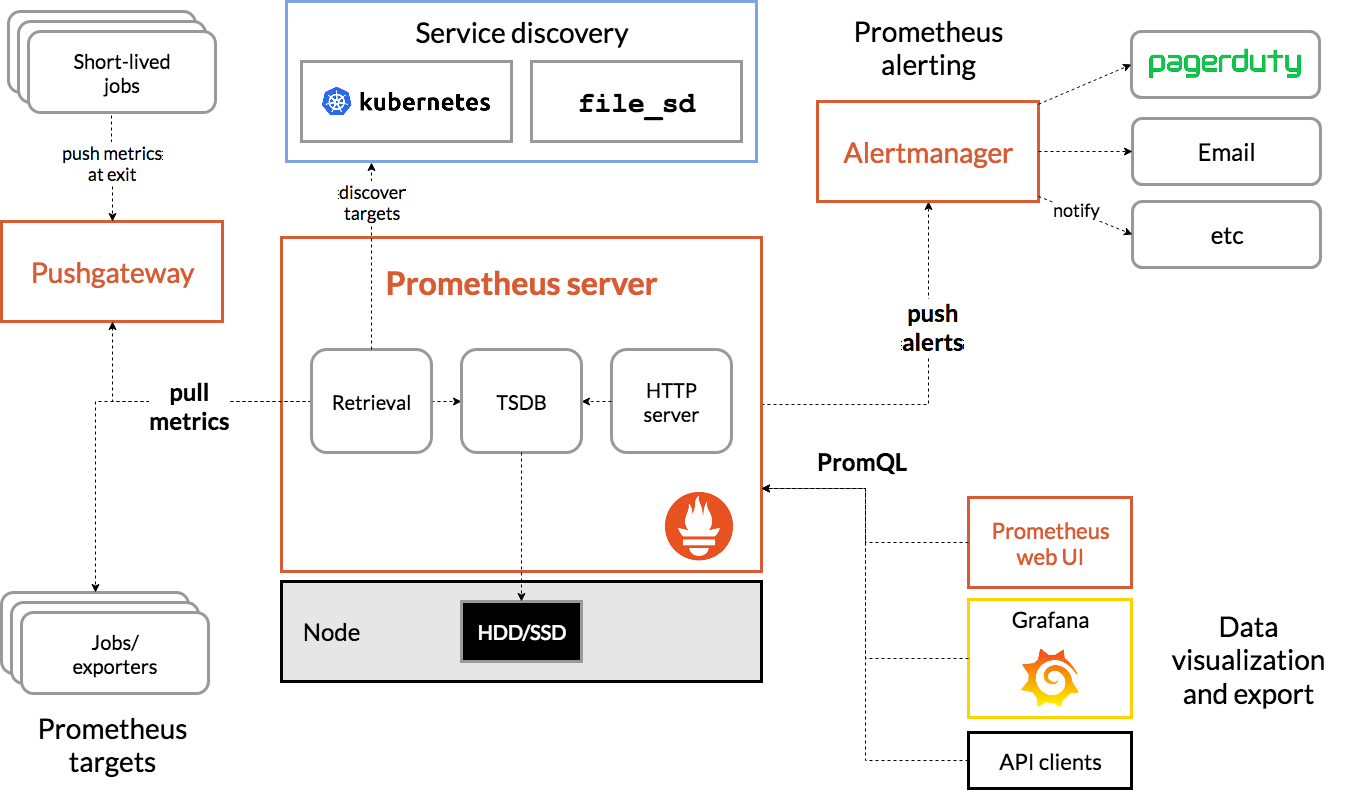
Prometheus基本原理
Prometheus 的基本原理是通过 HTTP 协议周期性抓取被监控组件的状态,任意组件只要提供对应的 HTTP 接口就可以接入监控。不需要任何 SDK 或者其他的集成过程。这样做非常适合做虚拟化环境监控系统,比如 VM、Docker、Kubernetes 等。输出被监控组件信息的 HTTP 接口被叫做 exporter 。目前互联网公司常用的组件大部分都有 exporter 可以直接使用,比如 Varnish、Haproxy、Nginx、MySQL、Linux 系统信息(包括磁盘、内存、CPU、网络等等)。
Prometheus服务过程
- Prometheus Daemon 负责定时去目标上抓取 metrics(指标)数据,每个抓取目标需要暴露一个 http 服务的接口给它定时抓取。Prometheus 支持通过配置文件、文本文件、Zookeeper、Consul、DNS SRV Lookup 等方式指定抓取目标。Prometheus 采用 PULL 的方式进行监控,即服务器可以直接通过目标 PULL 数据或者间接地通过中间网关来 Push 数据。
- Prometheus 在本地存储抓取的所有数据,并通过一定规则进行清理和整理数据,并把得到的结果存储到新的时间序列中。
- Prometheus 通过 PromQL 和其他 API 可视化地展示收集的数据。Prometheus 支持很多方式的图表可视化,例如 Grafana、自带的 Promdash 以及自身提供的模版引擎等等。Prometheus 还提供 HTTP API 的查询方式,自定义所需要的输出。
- PushGateway 支持 Client 主动推送 metrics 到 PushGateway,而 Prometheus 只是定时去 Gateway 上抓取数据。
- Alertmanager 是独立于 Prometheus 的一个组件,可以支持 Prometheus 的查询语句,提供十分灵活的报警方式。
Prometheus三大套件
- Server 主要负责数据采集和存储,提供 PromQL 查询语言的支持。
- Alertmanager 警告管理器,用来进行报警。
- Push Gateway 支持临时性 Job 主动推送指标的中间网关。
二、安装Prometheus
添加仓库并更新:
helm repo add prometheus-community https://prometheus-community.github.io/helm-chartshelm repo update
先创建一个namespace,以免默认添加到default:
kubectl create namespace prometheus
部署Prometheus:
helm install prometheus prometheus-community/prometheus -n prometheus
部署完成,看到控制台打印:
NAME: prometheusLAST DEPLOYED: Fri Oct 30 11:30:43 2020NAMESPACE: prometheusSTATUS: deployedREVISION: 1TEST SUITE: NoneNOTES:The Prometheus server can be accessed via port 80 on the following DNS name from within your cluster:prometheus-server.prometheus.svc.cluster.localGet the Prometheus server URL by running these commands in the same shell:export POD_NAME=$(kubectl get pods --namespace prometheus -l "app=prometheus,component=server" -o jsonpath="{.items[0].metadata.name}")kubectl --namespace prometheus port-forward $POD_NAME 9090The Prometheus alertmanager can be accessed via port 80 on the following DNS name from within your cluster:prometheus-alertmanager.prometheus.svc.cluster.localGet the Alertmanager URL by running these commands in the same shell:export POD_NAME=$(kubectl get pods --namespace prometheus -l "app=prometheus,component=alertmanager" -o jsonpath="{.items[0].metadata.name}")kubectl --namespace prometheus port-forward $POD_NAME 9093####################################################################################### WARNING: Pod Security Policy has been moved to a global property. ########### use .Values.podSecurityPolicy.enabled with pod-based ########### annotations ########### (e.g. .Values.nodeExporter.podSecurityPolicy.annotations) ######################################################################################The Prometheus PushGateway can be accessed via port 9091 on the following DNS name from within your cluster:prometheus-pushgateway.prometheus.svc.cluster.localGet the PushGateway URL by running these commands in the same shell:export POD_NAME=$(kubectl get pods --namespace prometheus -l "app=prometheus,component=pushgateway" -o jsonpath="{.items[0].metadata.name}")kubectl --namespace prometheus port-forward $POD_NAME 9091For more information on running Prometheus, visit:https://prometheus.io/
三、暴露Prometheus管理界面
首先在hosts中添加:
127.0.0.1 prometheus.dashboard.com
创建一个 IngressRoute:
apiVersion: traefik.containo.us/v1alpha1kind: IngressRoutemetadata:name: prometheus-routenamespace: prometheusspec:entryPoints:- webroutes:- match: Host(`prometheus.dashboard.com`)kind: Ruleservices:- name: prometheus-serverport: 80
应用即可:
kubectl apply -f prometheus/route.yaml
四、访问Prometheus管理界面
经过前面的一通操作,我们可以直接在浏览器中输入 http://prometheus.dashboard.com 访问: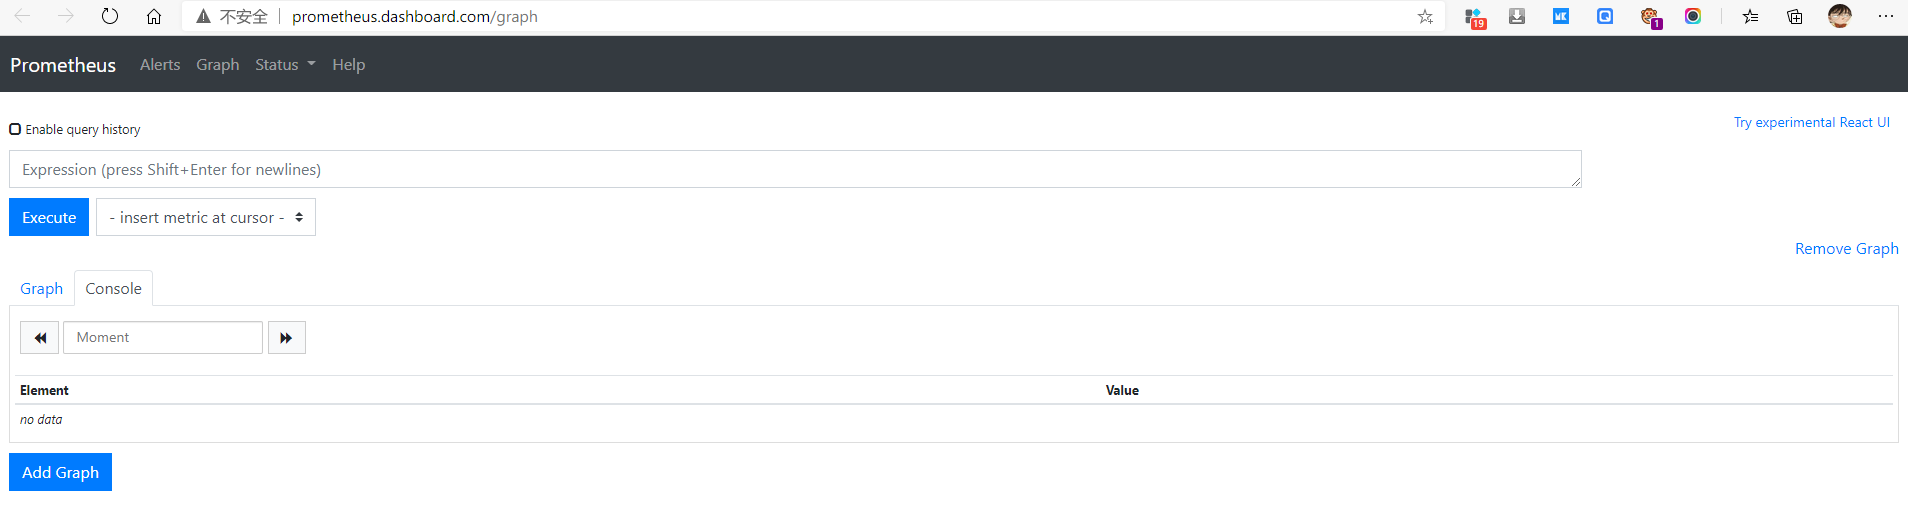
http://prometheus.dashboard.com/targets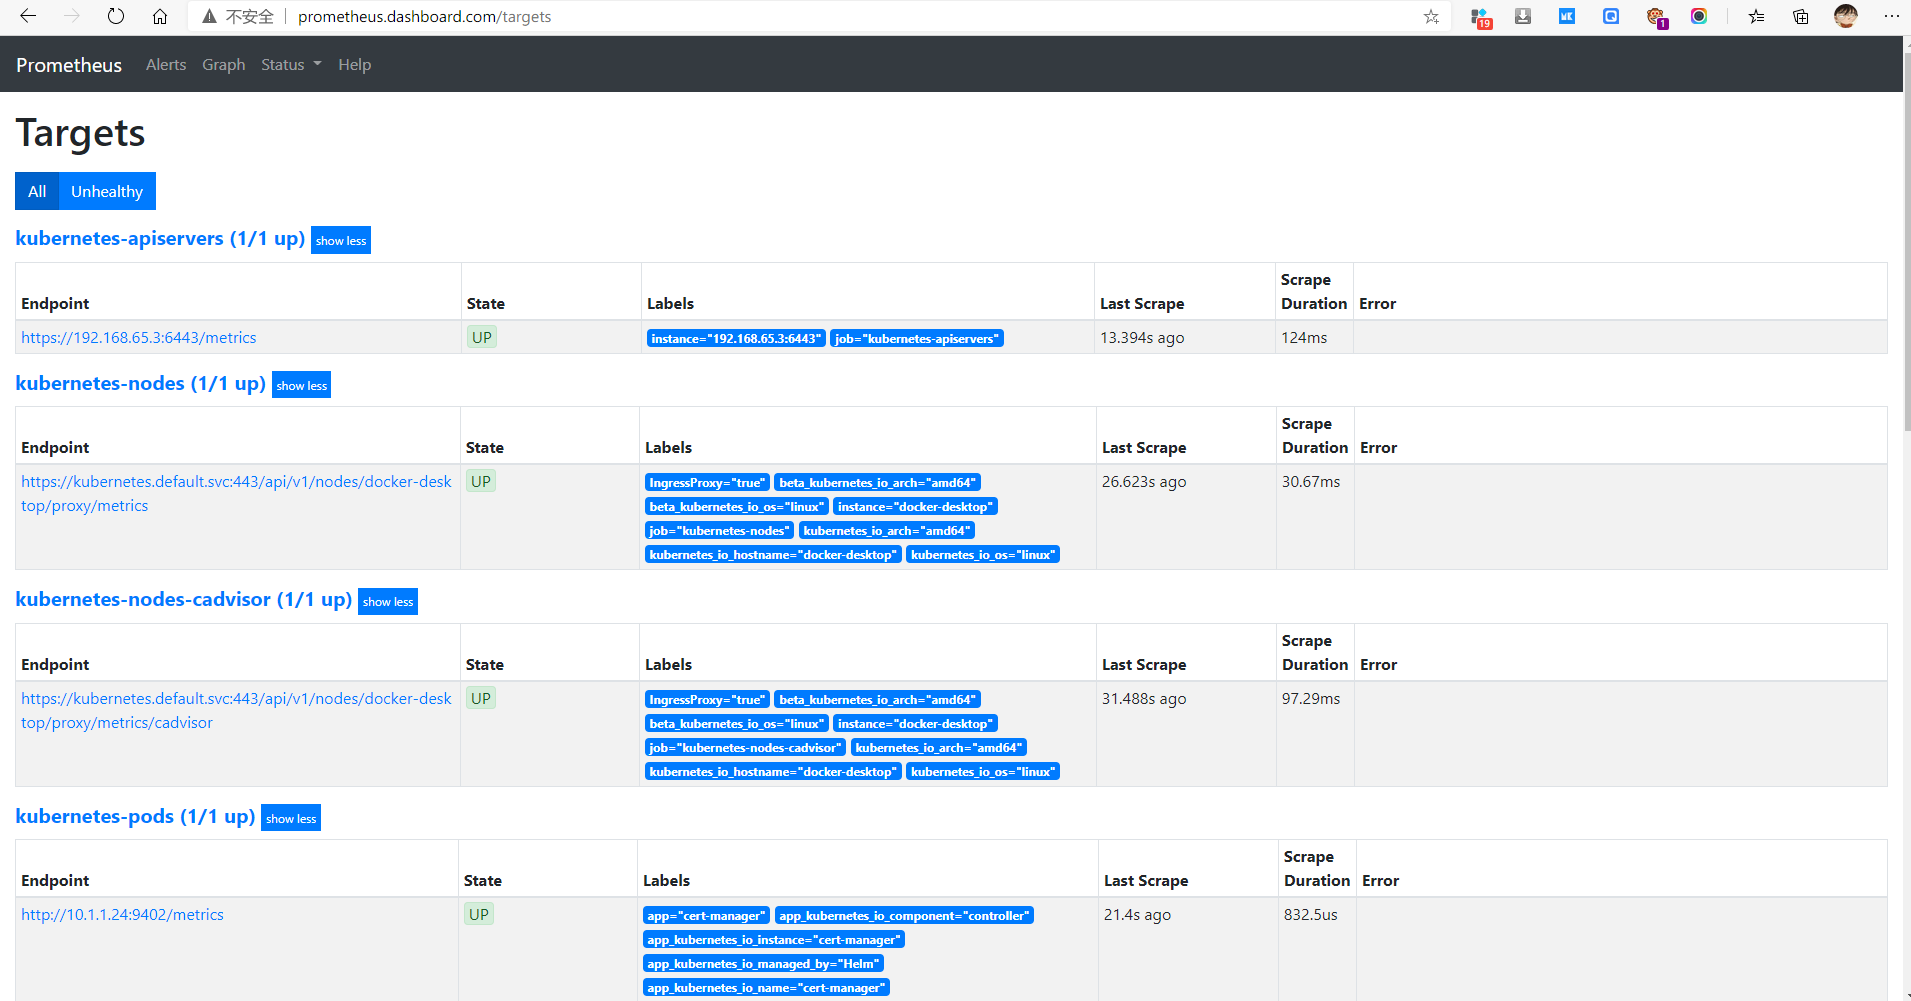
http://prometheus.dashboard.com/service-discovery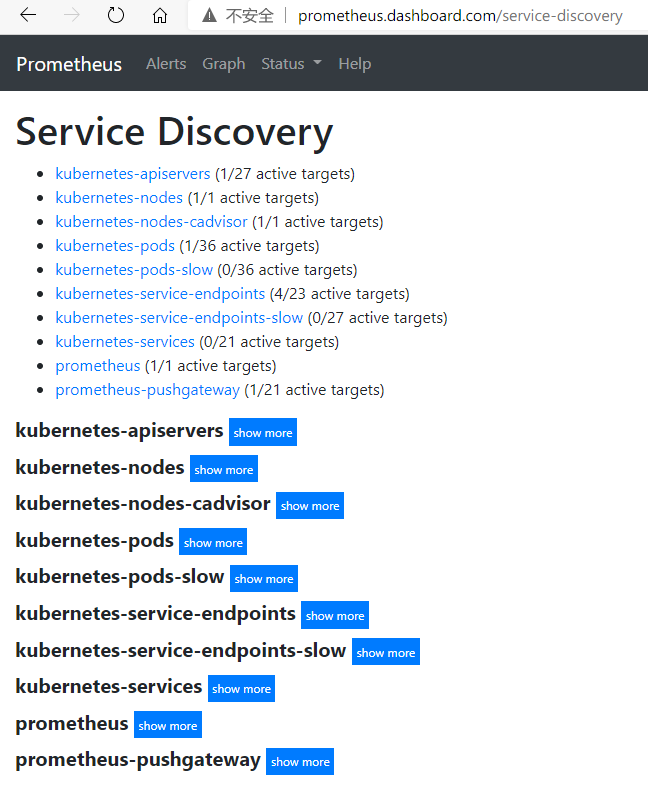
AlterManager
Pormetheus 的警告由独立的两部分组成。
Prometheus 服务中的警告规则发送警告到 Alertmanager。
然后这个 Alertmanager 管理这些警告。包括 silencing, inhibition, aggregation,以及通过一些方法发送通知,例如:email,PagerDuty 和 HipChat。
建立警告和通知的主要步骤:
- 创建和配置 Alertmanager
- 启动 Prometheus 服务时,通过-alertmanager.url 标志配置 Alermanager 地址,以便 Prometheus 服务能和 Alertmanager 建立连接。
参考资料

若有收获,就点个赞吧
0 人点赞
