问题描述
- 想标出下面曲线中某些特殊的点
解决方案
- 分两次plot,一次是全部的点,一次是你需要标记的点,记得hold on就ok了。
- 在绘制完上面两条曲线后
- hold on
- 用循环判断
- 一个点一个点的绘制
- 可以设置绘制的标记点的颜色、形状、大小,参考链接
- ‘MarkerSize’,8
- ‘MarkerEdgeColor’,’b’
- ‘MarkerFaceColor’,[0.5,0.5,0.5]
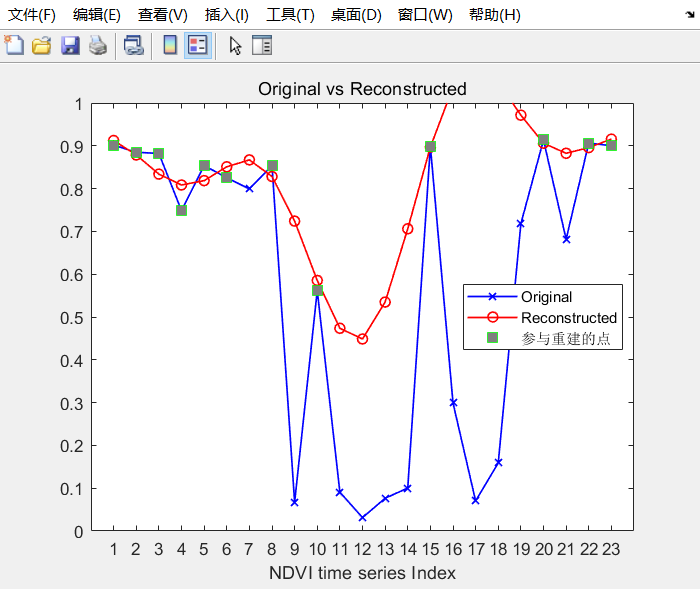
- 最终效果
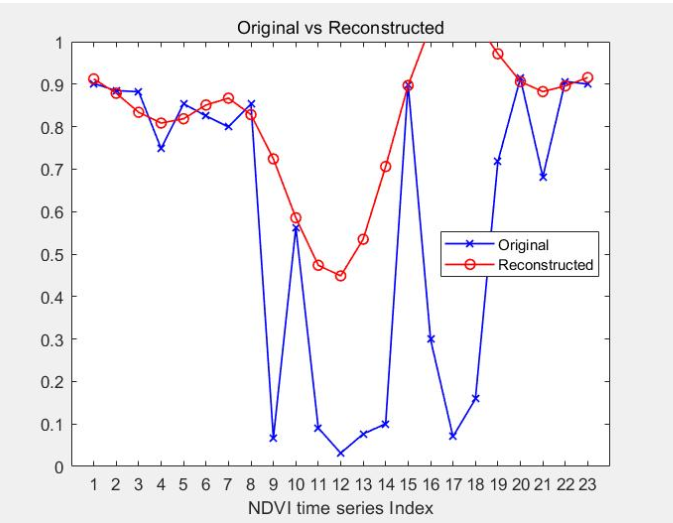
- 测试代码 ```matlab clc;clear all;close all; y=[9015,8848,8822,7485,8540,8252,7993,8536,669,5620,907,313,765,1004,8989,2991,703,1590,7180,9136,6816,9065,9002]; yr=[9124.046875,8786.291016,8338.423828,8083.894531,8186.080078,8509.376953,8670.788086,8283.386719,7240.817383,5854.158203,4736.520996,4486.240723,5349.107422,7061.093262,8970,10369.47461,10853.16797,10487.73633,9715.476563,9060.446289,8824.884766,8957.313477,9156.575195]; p=[1,1,1,1,1,1,0,1,0,1,0,0,0,0,1,0,0,0,0,1,0,1,1];
%% 绘图 ts = 1:23; fig = figure; % 新建一个figure,并将图像句柄保存到fig p1=plot(ts,y/10000,’-xb’); p1.LineWidth=1; title_name = [‘Original vs Reconstructed’]; title(title_name); xlabel(‘NDVI time series Index’);ylabel=’NDVI’; xlim=[0,23];ylim=[0,1]; set(gca,’xtick’,1:1:23) % handles可以指定具体坐标轴的句柄 set(gca,’ytick’,0:0.1:1) % handles可以指定具体坐标轴的句柄 axis([0 24 0 1]);%axis([xmin xmax ymin ymax]),设置绘制区域的范围
hold on; p2=plot(ts,yr/10000,’-or’); p2.LineWidth=1;
% %% 一个点测试 % hold on; % plot(1,yr(1)/10000,’gs’);
%% 多点标注 for i = 1:23 if p(i)==1 hold on; plot(i,y(i)/10000,’gs’,’MarkerSize’,8,’MarkerEdgeColor’,’g’,’MarkerFaceColor’,[0.5,0.5,0.5]); %g绿色 s方块 注意要/10000,hold on一般没问题,一个点都出不来的话,就可能是数据的问题 end end
%% 绘制图例 legend({‘Original’,’Reconstructed’,’参与重建的点’},’Location’,’best’);
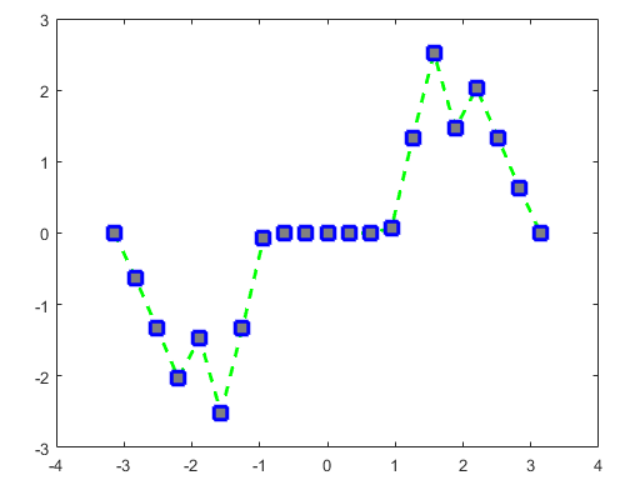
<a name="btzi1ef-2"></a>### 指定线宽、标记大小和标记颜色- [https://ww2.mathworks.cn/help/matlab/ref/plot.html](https://ww2.mathworks.cn/help/matlab/ref/plot.html?searchHighlight=plot%20%E7%82%B9%20%E5%B1%9E%E6%80%A7&s_tid=srchtitle)- 创建线图并使用 `LineSpec` 选项指定带正方形标记的绿色虚线。使用 `Name,Value` 对组来指定线宽、标记大小和标记颜色。将标记边颜色设置为蓝色,并使用 RGB 颜色值设置标记面颜色。```matlabx = -pi:pi/10:pi;y = tan(sin(x)) - sin(tan(x));figureplot(x,y,'--gs',...'LineWidth',2,...'MarkerSize',10,...'MarkerEdgeColor','b',...'MarkerFaceColor',[0.5,0.5,0.5])

若有收获,就点个赞吧
0 人点赞
