1 简介
pprof 是用于可视化和分析性能分析数据的工具
pprof 以 profile.proto 读取分析样本的集合,并生成报告以可视化并帮助分析数据(支持文本和图形报告)
profile.proto 是一个 Protocol Buffer v3 的描述文件,它描述了一组 callstack 和 symbolization 信息, 作用是表示统计分析的一组采样的调用栈,是很常见的 stacktrace 配置文件格式
常用的模式有:
- Report generation:报告生成
- Interactive terminal use:交互式终端使用
- Web interface:Web 界面
在计算机性能调试领域里,profiling 是指对应用程序的画像,画像就是应用程序使用 CPU 和内存的情况。
- runtime/pprof:采集程序(非 Server)的运行数据进行分析
- net/http/pprof:采集 HTTP Server 的运行时数据进行分析
pprof开启后,每隔一段时间(10ms)就会收集下当前的堆栈信息,获取每个函数占用的CPU以及内存资源;最后通过对这些采样数据进行分析,形成一个性能分析报告。
- CPU Profiling:CPU 分析,按照一定的频率采集所监听的应用程序 CPU(含寄存器)的使用情况,可确定应用程序在主动消耗 CPU 周期时花费时间的位置
- Memory Profiling:内存分析,在应用程序进行堆分配时记录堆栈跟踪,用于监视当前和历史内存使用情况,以及检查内存泄漏
- Block Profiling:阻塞分析,记录 goroutine 阻塞等待同步(包括定时器通道)的位置
- Mutex Profiling:互斥锁分析,报告互斥锁的竞争情况
2 代码示例
package mainimport ("math/rand""os""runtime/pprof""time")const (row = 6col = 5)func fillMatrix(m *[row][col]int) {s := rand.New(rand.NewSource(time.Now().UnixNano()))for i := 0; i < row; i++ {for j := 0; j < col; j++ {m[i][j] = s.Intn(100000)}}rand.Intn(32)}func calculate(m *[row][col]int) {for i := 0; i < row; i++ {tmp := 0for j := 0; j < col; j++ {tmp += m[i][j]}}}func main() {// 对CPU进行profile(性能分析)f1, err := os.Create("cpu.prof")if err != nil {return}err = pprof.StartCPUProfile(f1)if err != nil {return}defer pprof.StopCPUProfile()// 进行代码运算x := [row][col]int{}fillMatrix(&x)calculate(&x)time.Sleep(10 * time.Second)// 对堆进行profile(性能分析)f2, err2 := os.Create("mem.prof")if err2 != nil {return}err2 = pprof.WriteHeapProfile(f2)if err2 != nil {return}f2.Close()// 对go程进行profile(性能分析)f3, err3 := os.Create("goroutine.prof")if err3 != nil {return}gprof := pprof.Lookup("goroutine")if gprof == nil {return}gprof.WriteTo(f3, 0)f3.Close()}
3 分析prof文件
go tool pprof cpu.prof
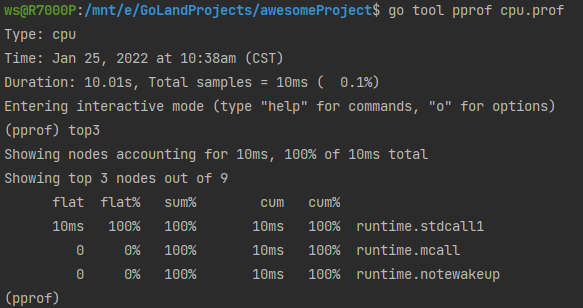
结束后将默认进入 pprof 的交互式命令模式,可以对分析的结果进行查看或导出。具体可执行 pprof help 查看命令说明
- flat:给定函数上运行耗时
- flat%:同上的 CPU 运行耗时总比例
- sum%:给定函数累积使用 CPU 总比例
- cum:当前函数加上它之上的调用运行总耗时
- cum%:同上的 CPU 运行耗时总比例

若有收获,就点个赞吧
0 人点赞
