在前面的学习中我们使用用一个 kubectl scale 命令可以来实现 Pod 的扩缩容功能,但是这个毕竟是完全手动操作的,要应对线上的各种复杂情况,我们需要能够做到自动化去感知业务,来自动进行扩缩容。为此,Kubernetes 也为我们提供了这样的一个资源对象:Horizontal Pod Autoscaling(Pod 水平自动伸缩),简称HPA,HPA 通过监控分析一些控制器控制的所有 Pod 的负载变化情况来确定是否需要调整 Pod 的副本数量,这是 HPA 最基本的原理: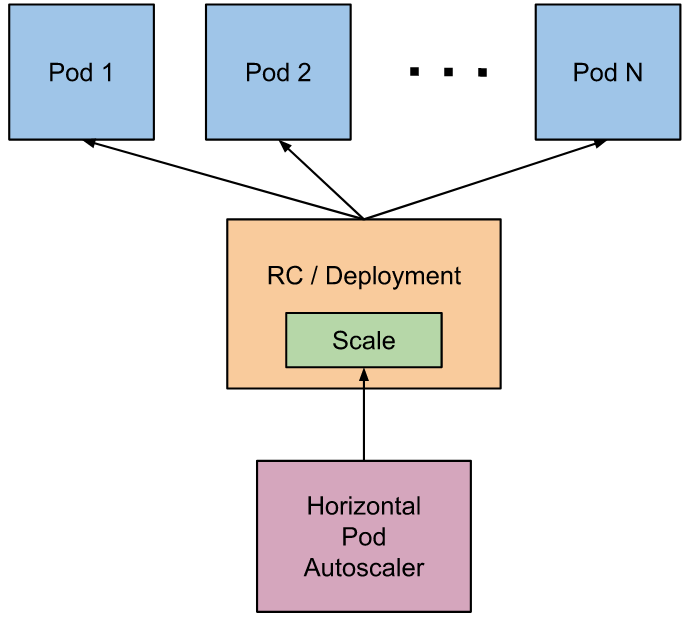
我们可以简单的通过 kubectl autoscale 命令来创建一个 HPA 资源对象,HPA Controller默认30s轮询一次(可通过 kube-controller-manager 的--horizontal-pod-autoscaler-sync-period 参数进行设置),查询指定的资源中的 Pod 资源使用率,并且与创建时设定的值和指标做对比,从而实现自动伸缩的功能。
Metrics Server
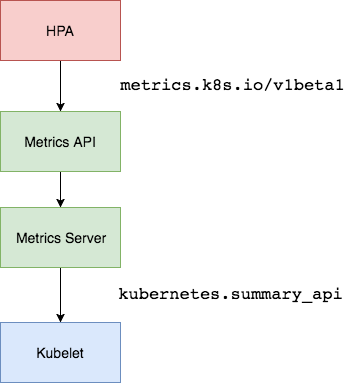
在 HPA 的第一个版本中,我们需要 Heapster 提供 CPU 和内存指标,在 HPA v2 过后就需要安装 Metrcis Server 了,Metrics Server 可以通过标准的 Kubernetes API 把监控数据暴露出来,有了 Metrics Server 之后,我们就完全可以通过标准的 Kubernetes API 来访问我们想要获取的监控数据了:
https://10.96.0.1/apis/metrics.k8s.io/v1beta1/namespaces/<namespace-name>/pods/<pod-name>
比如当我们访问上面的 API 的时候,我们就可以获取到该 Pod 的资源数据,这些数据其实是来自于 kubelet 的 Summary API 采集而来的。不过需要说明的是我们这里可以通过标准的 API 来获取资源监控数据,并不是因为 Metrics Server 就是 APIServer 的一部分,而是通过 Kubernetes 提供的 Aggregator 汇聚插件来实现的,是独立于 APIServer 之外运行的。
聚合 API
Aggregator 允许开发人员编写一个自己的服务,把这个服务注册到 Kubernetes 的 APIServer 里面去,这样我们就可以像原生的 APIServer 提供的 API 使用自己的 API 了,我们把自己的服务运行在 Kubernetes 集群里面,然后 Kubernetes 的 Aggregator 通过 Service 名称就可以转发到我们自己写的 Service 里面去了。这样这个聚合层就带来了很多好处:
- 增加了 API 的扩展性,开发人员可以编写自己的 API 服务来暴露他们想要的 API。
- 丰富了 API,核心 kubernetes 团队阻止了很多新的 API 提案,通过允许开发人员将他们的 API 作为单独的服务公开,这样就无须社区繁杂的审查了。
- 开发分阶段实验性 API,新的 API 可以在单独的聚合服务中开发,当它稳定之后,在合并会 APIServer 就很容易了。
- 确保新 API 遵循 Kubernetes 约定,如果没有这里提出的机制,社区成员可能会被迫推出自己的东西,这样很可能造成社区成员和社区约定不一致。
安装
所以现在我们要使用 HPA,就需要在集群中安装 Metrics Server 服务,要安装 Metrics Server 就需要开启 Aggregator,因为 Metrics Server 就是通过该代理进行扩展的,不过我们集群是通过 Kubeadm 搭建的,默认已经开启了,如果是二进制方式安装的集群,需要单独配置 kube-apsierver 添加如下所示的参数:
--requestheader-client-ca-file=<path to aggregator CA cert>--requestheader-allowed-names=aggregator--requestheader-extra-headers-prefix=X-Remote-Extra---requestheader-group-headers=X-Remote-Group--requestheader-username-headers=X-Remote-User--proxy-client-cert-file=<path to aggregator proxy cert>--proxy-client-key-file=<path to aggregator proxy key>
如果 kube-proxy 没有和 APIServer 运行在同一台主机上,那么需要确保启用了如下 kube-apsierver 的参数:
--enable-aggregator-routing=true
对于这些证书的生成方式,我们可以查看官方文档:https://github.com/kubernetes-sigs/apiserver-builder-alpha/blob/master/docs/concepts/auth.md。Aggregator 聚合层启动完成后,就可以来安装 Metrics Server 了,我们可以获取该仓库的官方安装资源清单:
# 官方仓库地址:https://github.com/kubernetes-sigs/metrics-server$ wget https://github.com/kubernetes-sigs/metrics-server/releases/download/v0.3.6/components.yaml
在部署之前,修改 components.yaml 的镜像地址为
hostNetwork: true # 使用hostNetwork模式containers:- name: metrics-serverimage: registry.aliyuncs.com/google_containers/metrics-server-amd64:v0.3.6
等部署完成后,可以查看 Pod 日志是否正常:
$ kubectl apply -f components.yaml$ kubectl get pods -n kube-system -l k8s-app=metrics-serverNAME READY STATUS RESTARTS AGEmetrics-server-6886856d7c-g5k6q 1/1 Running 0 2m39s$ kubectl logs -f metrics-server-6886856d7c-g5k6q -n kube-system......E1119 09:05:57.234312 1 manager.go:111] unable to fully collect metrics: [unable to fully scrape metrics from source kubelet_summary:ydzs-node1: unable to fetch metrics from Kubelet ydzs-node1 (ydzs-node1): Get https://ydzs-node1:10250/stats/summary?only_cpu_and_memory=true: dial tcp: lookup ydzs-node1 on 10.96.0.10:53: no such host, unable to fully scrape metrics from source kubelet_summary:ydzs-node4: unable to fetch metrics from Kubelet ydzs-node4 (ydzs-node4): Get https://ydzs-node4:10250/stats/summary?only_cpu_and_memory=true: dial tcp: lookup ydzs-node4 on 10.96.0.10:53: no such host, unable to fully scrape metrics from source kubelet_summary:ydzs-node3: unable to fetch metrics from Kubelet ydzs-node3 (ydzs-node3): Get https://ydzs-node3:10250/stats/summary?only_cpu_and_memory=true: dial tcp: lookup ydzs-node3 on 10.96.0.10:53: no such host, unable to fully scrape metrics from source kubelet_summary:ydzs-master: unable to fetch metrics from Kubelet ydzs-master (ydzs-master): Get https://ydzs-master:10250/stats/summary?only_cpu_and_memory=true: dial tcp: lookup ydzs-master on 10.96.0.10:53: no such host, unable to fully scrape metrics from source kubelet_summary:ydzs-node2: unable to fetch metrics from Kubelet ydzs-node2 (ydzs-node2): Get https://ydzs-node2:10250/stats/summary?only_cpu_and_memory=true: dial tcp: lookup ydzs-node2 on 10.96.0.10:53: no such host]
我们可以发现 Pod 中出现了一些错误信息:xxx: no such host,我们看到这个错误信息一般就可以确定是 DNS 解析不了造成的,我们可以看到 Metrics Server 会通过 kubelet 的 10250 端口获取信息,使用的是 hostname,我们部署集群的时候在节点的 /etc/hosts 里面添加了节点的 hostname 和 ip 的映射,但是是我们的 Metrics Server 的 Pod 内部并没有这个 hosts 信息,当然也就不识别 hostname 了,要解决这个问题,有两种方法:
第一种方法就是在集群内部的 DNS 服务里面添加上 hostname 的解析,比如我们这里集群中使用的是 CoreDNS,我们就可以去修改下 CoreDNS 的 Configmap 信息,添加上 hosts 信息:
$ kubectl edit configmap coredns -n kube-systemapiVersion: v1data:Corefile: |.:53 {errorshealthhosts { # 添加集群节点hosts隐射信息10.151.30.11 ydzs-master10.151.30.57 ydzs-node310.151.30.59 ydzs-node410.151.30.22 ydzs-node110.151.30.23 ydzs-node2fallthrough}kubernetes cluster.local in-addr.arpa ip6.arpa {pods insecureupstreamfallthrough in-addr.arpa ip6.arpa}prometheus :9153proxy . /etc/resolv.confcache 30reload}kind: ConfigMapmetadata:creationTimestamp: 2019-05-18T11:07:46Zname: corednsnamespace: kube-system
这样当在集群内部访问集群的 hostname 的时候就可以解析到对应的 ip 了,另外一种方法就是在 metrics-server 的启动参数中修改 kubelet-preferred-address-types 参数,如下:
args:- --cert-dir=/tmp- --secure-port=4443- --kubelet-preferred-address-types=InternalIP
我们这里使用第二种方式,然后重新安装:
$ kubectl get pods -n kube-system -l k8s-app=metrics-serverNAME READY STATUS RESTARTS AGEmetrics-server-6dcfdf89b5-tvdcp 1/1 Running 0 33s$ kubectl logs -f metric-metrics-server-58fc94d9f-jlxcb -n kube-system......E1119 09:08:49.805959 1 manager.go:111] unable to fully collect metrics: [unable to fully scrape metrics from source kubelet_summary:ydzs-node3: unable to fetch metrics from Kubelet ydzs-node3 (10.151.30.57): Get https://10.151.30.57:10250/stats/summary?only_cpu_and_memory=true: x509: cannot validate certificate for 10.151.30.57 because it doesn't contain any IP SANs, unable to fully scrape metrics from source kubelet_summary:ydzs-node4: unable to fetch metrics from Kubelet ydzs-node4 (10.151.30.59): Get https://10.151.30.59:10250/stats/summary?only_cpu_and_memory=true: x509: cannot validate certificate for 10.151.30.59 because it doesn't contain any IP SANs, unable to fully scrape metrics from source kubelet_summary:ydzs-node2: unable to fetch metrics from Kubelet ydzs-node2 (10.151.30.23): Get https://10.151.30.23:10250/stats/summary?only_cpu_and_memory=true: x509: cannot validate certificate for 10.151.30.23 because it doesn't contain any IP SANs, unable to fully scrape metrics from source kubelet_summary:ydzs-master: unable to fetch metrics from Kubelet ydzs-master (10.151.30.11): Get https://10.151.30.11:10250/stats/summary?only_cpu_and_memory=true: x509: cannot validate certificate for 10.151.30.11 because it doesn't contain any IP SANs, unable to fully scrape metrics from source kubelet_summary:ydzs-node1: unable to fetch metrics from Kubelet ydzs-node1 (10.151.30.22): Get https://10.151.30.22:10250/stats/summary?only_cpu_and_memory=true: x509: cannot validate certificate for 10.151.30.22 because it doesn't contain any IP SANs]
因为部署集群的时候,CA 证书并没有把各个节点的 IP 签上去,所以这里 Metrics Server 通过 IP 去请求时,提示签的证书没有对应的 IP(错误:x509: cannot validate certificate for 10.151.30.22 because it doesn’t contain any IP SANs),我们可以添加一个--kubelet-insecure-tls参数跳过证书校验:
args:- --cert-dir=/tmp- --secure-port=4443- --kubelet-insecure-tls- --kubelet-preferred-address-types=InternalIP
然后再重新安装即可成功!可以通过如下命令来验证:
$ kubectl apply -f components.yaml$ kubectl get pods -n kube-system -l k8s-app=metrics-serverNAME READY STATUS RESTARTS AGEmetrics-server-5d4dbb78bb-6klw6 1/1 Running 0 14s$ kubectl logs -f metrics-server-5d4dbb78bb-6klw6 -n kube-systemI1119 09:10:44.249092 1 serving.go:312] Generated self-signed cert (/tmp/apiserver.crt, /tmp/apiserver.key)I1119 09:10:45.264076 1 secure_serving.go:116] Serving securely on [::]:4443$ kubectl get apiservice | grep metricsv1beta1.metrics.k8s.io kube-system/metrics-server True 9m$ kubectl get --raw "/apis/metrics.k8s.io/v1beta1/nodes"{"kind":"NodeMetricsList","apiVersion":"metrics.k8s.io/v1beta1","metadata":{"selfLink":"/apis/metrics.k8s.io/v1beta1/nodes"},"items":[{"metadata":{"name":"ydzs-node3","selfLink":"/apis/metrics.k8s.io/v1beta1/nodes/ydzs-node3","creationTimestamp":"2019-11-19T09:11:53Z"},"timestamp":"2019-11-19T09:11:38Z","window":"30s","usage":{"cpu":"240965441n","memory":"3004360Ki"}},{"metadata":{"name":"ydzs-node4","selfLink":"/apis/metrics.k8s.io/v1beta1/nodes/ydzs-node4","creationTimestamp":"2019-11-19T09:11:53Z"},"timestamp":"2019-11-19T09:11:37Z","window":"30s","usage":{"cpu":"167036681n","memory":"2574664Ki"}},{"metadata":{"name":"ydzs-master","selfLink":"/apis/metrics.k8s.io/v1beta1/nodes/ydzs-master","creationTimestamp":"2019-11-19T09:11:53Z"},"timestamp":"2019-11-19T09:11:38Z","window":"30s","usage":{"cpu":"350907350n","memory":"2986716Ki"}},{"metadata":{"name":"ydzs-node1","selfLink":"/apis/metrics.k8s.io/v1beta1/nodes/ydzs-node1","creationTimestamp":"2019-11-19T09:11:53Z"},"timestamp":"2019-11-19T09:11:39Z","window":"30s","usage":{"cpu":"1319638039n","memory":"2094376Ki"}},{"metadata":{"name":"ydzs-node2","selfLink":"/apis/metrics.k8s.io/v1beta1/nodes/ydzs-node2","creationTimestamp":"2019-11-19T09:11:53Z"},"timestamp":"2019-11-19T09:11:36Z","window":"30s","usage":{"cpu":"320381888n","memory":"3270368Ki"}}]}$ kubectl top nodesNAME CPU(cores) CPU% MEMORY(bytes) MEMORY%ydzs-master 351m 17% 2916Mi 79%ydzs-node1 1320m 33% 2045Mi 26%ydzs-node2 321m 8% 3193Mi 41%ydzs-node3 241m 6% 2933Mi 37%ydzs-node4 168m 4% 2514Mi 32%
现在我们可以通过 kubectl top 命令来获取到资源数据了,证明 Metrics Server 已经安装成功了。
HPA
现在我们用 Deployment 来创建一个 Nginx Pod,然后利用 HPA 来进行自动扩缩容。资源清单如下所示:(hpa-demo.yaml)
apiVersion: apps/v1kind: Deploymentmetadata:name: hpa-demospec:selector:matchLabels:app: nginxtemplate:metadata:labels:app: nginxspec:containers:- name: nginximage: nginxports:- containerPort: 80
然后直接创建 Deployment:
$ kubectl apply -f hpa-demo.yamldeployment.apps/hpa-demo created$ kubectl get pods -l app=nginxNAME READY STATUS RESTARTS AGEhpa-demo-85ff79dd56-pz8th 1/1 Running 0 21s
现在我们来创建一个 HPA 资源对象,可以使用kubectl autoscale命令来创建:
$ kubectl autoscale deployment hpa-demo --cpu-percent=10 --min=1 --max=10horizontalpodautoscaler.autoscaling/hpa-demo autoscaled$ kubectl get hpaNAME REFERENCE TARGETS MINPODS MAXPODS REPLICAS AGEhpa-demo Deployment/hpa-demo <unknown>/10% 1 10 1 16s
此命令创建了一个关联资源 hpa-demo 的 HPA,最小的 Pod 副本数为1,最大为10。HPA 会根据设定的 cpu 使用率(10%)动态的增加或者减少 Pod 数量。
当然我们依然还是可以通过创建 YAML 文件的形式来创建 HPA 资源对象。如果我们不知道怎么编写的话,可以查看上面命令行创建的HPA的YAML文件:
$ kubectl get hpa hpa-demo -o yamlapiVersion: autoscaling/v1kind: HorizontalPodAutoscalermetadata:annotations:autoscaling.alpha.kubernetes.io/conditions: '[{"type":"AbleToScale","status":"True","lastTransitionTime":"2019-11-19T09:15:12Z","reason":"SucceededGetScale","message":"theHPA controller was able to get the target''s current scale"},{"type":"ScalingActive","status":"False","lastTransitionTime":"2019-11-19T09:15:12Z","reason":"FailedGetResourceMetric","message":"theHPA was unable to compute the replica count: missing request for cpu"}]'creationTimestamp: "2019-11-19T09:14:56Z"name: hpa-demonamespace: defaultresourceVersion: "3094084"selfLink: /apis/autoscaling/v1/namespaces/default/horizontalpodautoscalers/hpa-demouid: b84d79f1-75b0-46e0-95b5-4cbe3509233bspec:maxReplicas: 10minReplicas: 1scaleTargetRef:apiVersion: apps/v1kind: Deploymentname: hpa-demotargetCPUUtilizationPercentage: 10status:currentReplicas: 1desiredReplicas: 0
然后我们可以根据上面的 YAML 文件就可以自己来创建一个基于 YAML 的 HPA 描述文件了。但是我们发现上面信息里面出现了一些 Fail 信息,我们来查看下这个 HPA 对象的信息:
$ kubectl describe hpa hpa-demoName: hpa-demoNamespace: defaultLabels: <none>Annotations: <none>CreationTimestamp: Tue, 19 Nov 2019 17:14:56 +0800Reference: Deployment/hpa-demoMetrics: ( current / target )resource cpu on pods (as a percentage of request): <unknown> / 10%Min replicas: 1Max replicas: 10Deployment pods: 1 current / 0 desiredConditions:Type Status Reason Message---- ------ ------ -------AbleToScale True SucceededGetScale the HPA controller was able to get the target's current scaleScalingActive False FailedGetResourceMetric the HPA was unable to compute the replica count: missing request for cpuEvents:Type Reason Age From Message---- ------ ---- ---- -------Warning FailedGetResourceMetric 14s (x4 over 60s) horizontal-pod-autoscaler missing request for cpuWarning FailedComputeMetricsReplicas 14s (x4 over 60s) horizontal-pod-autoscaler invalid metrics (1 invalid out of 1), first error is: failed to get cpu utilization: missing request for cpu
我们可以看到上面的事件信息里面出现了 failed to get cpu utilization: missing request for cpu 这样的错误信息。这是因为我们上面创建的 Pod 对象没有添加 request 资源声明,这样导致 HPA 读取不到 CPU 指标信息,所以如果要想让 HPA 生效,对应的 Pod 资源必须添加 requests 资源声明,更新我们的资源清单文件:
apiVersion: apps/v1kind: Deploymentmetadata:name: hpa-demospec:selector:matchLabels:app: nginxtemplate:metadata:labels:app: nginxspec:containers:- name: nginximage: nginxports:- containerPort: 80resources:requests:memory: 50Micpu: 50m
然后重新更新 Deployment,重新创建 HPA 对象:
$ kubectl apply -f hpa.yamldeployment.apps/hpa-demo configured$ kubectl get pods -o wide -l app=nginxNAME READY STATUS RESTARTS AGE IP NODE NOMINATED NODE READINESS GATEShpa-demo-69968bb59f-twtdp 1/1 Running 0 4m11s 10.244.4.97 ydzs-node4 <none> <none>$ kubectl delete hpa hpa-demohorizontalpodautoscaler.autoscaling "hpa-demo" deleted$ kubectl autoscale deployment hpa-demo --cpu-percent=10 --min=1 --max=10horizontalpodautoscaler.autoscaling/hpa-demo autoscaled$ kubectl describe hpa hpa-demoName: hpa-demoNamespace: defaultLabels: <none>Annotations: <none>CreationTimestamp: Tue, 19 Nov 2019 17:23:49 +0800Reference: Deployment/hpa-demoMetrics: ( current / target )resource cpu on pods (as a percentage of request): 0% (0) / 10%Min replicas: 1Max replicas: 10Deployment pods: 1 current / 1 desiredConditions:Type Status Reason Message---- ------ ------ -------AbleToScale True ScaleDownStabilized recent recommendations were higher than current one, applying the highest recent recommendationScalingActive True ValidMetricFound the HPA was able to successfully calculate a replica count from cpu resource utilization (percentage of request)ScalingLimited False DesiredWithinRange the desired count is within the acceptable rangeEvents: <none>$ kubectl get hpaNAME REFERENCE TARGETS MINPODS MAXPODS REPLICAS AGEhpa-demo Deployment/hpa-demo 0%/10% 1 10 1 52s
现在可以看到 HPA 资源对象已经正常了,现在我们来增大负载进行测试,我们来创建一个 busybox 的 Pod,并且循环访问上面创建的 Pod:
$ kubectl run -it --image busybox test-hpa --restart=Never --rm /bin/shIf you don't see a command prompt, try pressing enter./ # while true; do wget -q -O- http://10.244.4.97; done
下图可以看到,HPA 已经开始工作:
$ kubectl get hpaNAME REFERENCE TARGETS MINPODS MAXPODS REPLICAS AGEhpa-demo Deployment/hpa-demo 338%/10% 1 10 1 5m15s$ kubectl get pods -l app=nginx --watchNAME READY STATUS RESTARTS AGEhpa-demo-69968bb59f-8hjnn 1/1 Running 0 22shpa-demo-69968bb59f-9ss9f 1/1 Running 0 22shpa-demo-69968bb59f-bllsd 1/1 Running 0 22shpa-demo-69968bb59f-lnh8k 1/1 Running 0 37shpa-demo-69968bb59f-r8zfh 1/1 Running 0 22shpa-demo-69968bb59f-twtdp 1/1 Running 0 6m43shpa-demo-69968bb59f-w792g 1/1 Running 0 37shpa-demo-69968bb59f-zlxkp 1/1 Running 0 37shpa-demo-69968bb59f-znp6q 0/1 ContainerCreating 0 6shpa-demo-69968bb59f-ztnvx 1/1 Running 0 6s
我们可以看到已经自动拉起了很多新的 Pod,最后定格在了我们上面设置的 10 个 Pod,同时查看资源 hpa-demo 的副本数量,副本数量已经从原来的1变成了10个:
$ kubectl get deployment hpa-demoNAME READY UP-TO-DATE AVAILABLE AGEhpa-demo 10/10 10 10 17m
查看 HPA 资源的对象了解工作过程:
$ kubectl describe hpa hpa-demoName: hpa-demoNamespace: defaultLabels: <none>Annotations: <none>CreationTimestamp: Tue, 19 Nov 2019 17:23:49 +0800Reference: Deployment/hpa-demoMetrics: ( current / target )resource cpu on pods (as a percentage of request): 0% (0) / 10%Min replicas: 1Max replicas: 10Deployment pods: 10 current / 10 desiredConditions:Type Status Reason Message---- ------ ------ -------AbleToScale True ScaleDownStabilized recent recommendations were higher than current one, applying the highest recent recommendationScalingActive True ValidMetricFound the HPA was able to successfully calculate a replica count from cpu resource utilization (percentage of request)ScalingLimited True TooManyReplicas the desired replica count is more than the maximum replica countEvents:Type Reason Age From Message---- ------ ---- ---- -------Normal SuccessfulRescale 5m45s horizontal-pod-autoscaler New size: 4; reason: cpu resource utilization (percentage of request) above targetNormal SuccessfulRescale 5m30s horizontal-pod-autoscaler New size: 8; reason: cpu resource utilization (percentage of request) above targetNormal SuccessfulRescale 5m14s horizontal-pod-autoscaler New size: 10; reason: cpu resource utilization (percentage of request) above target
同样的这个时候我们来关掉 busybox 来减少负载,然后等待一段时间观察下 HPA 和 Deployment 对象:
$ kubectl get hpaNAME REFERENCE TARGETS MINPODS MAXPODS REPLICAS AGEhpa-demo Deployment/hpa-demo 0%/10% 1 10 1 14m$ kubectl get deployment hpa-demoNAME READY UP-TO-DATE AVAILABLE AGEhpa-demo 1/1 1 1 24m
可以看到副本数量已经由 10 变为 1,当前我们只是演示了 CPU 使用率这一个指标,在后面的课程中我们还会学习到根据自定义的监控指标来自动对 Pod 进行扩缩容。
缩放间隙 从 Kubernetes
v1.12版本开始我们可以通过设置kube-controller-manager组件的--horizontal-pod-autoscaler-downscale-stabilization参数来设置一个持续时间,用于指定在当前操作完成后,HPA必须等待多长时间才能执行另一次缩放操作。默认为5分钟,也就是默认需要等待5分钟后才会开始自动缩放。

若有收获,就点个赞吧
0 人点赞
