原文链接:
上篇请浏览:Markdown作图指南(上)

在上一篇Markdown最新作图指南(上)当中,我给大家介绍了在Typora中使用Flowchart.js 快速绘制流程图的方法。
这一篇中我会继续介绍另一个可以使用Markdown编辑器作图的项目,功能更强大、样式更加丰富的mermaid.js。
下篇:mermaid.js
Ⅰ. mermaid.js 简介

相比于flowchart.js专注于流程图,mermaid.js的“野心”要大得多:官方文档中就直接说明想以markdown的风格替换掉Visio等较重的工具。
不过作者也并非吹牛,除了获得了2019年度的 JS Open Source Awards ,还在Github上收获28.8k的Star数。
- 项目发起人对该项目的介绍:
https://github.com/mermaid-js/mermaid/issues/866
- 项目地址:
https://github.com/mermaid-js/mermaid
- 项目文档:
https://mermaid-js.github.io/mermaid/#/
- 在线编辑器:
https://mermaidjs.github.io/mermaid-live-editor/
项目最新版本为为 v8.4,支持的图表类型有:
- Flow:流程图
- Sequence:序列图
- Gantt:甘特图
- Class:类图
- State:状态图
- Pie:饼图
Git:Git图(尚在测试)
目前除了Git图,其余六种图表都已经在最新版的Typora中可以使用。
如果想要在Typora中使用mermaid.js,只需要将代码块的语言设置为mermaid即可。
Ⅱ. mermaid.js语法
不同于 flowchart.js,由于mermaid.js支持多种不同类别的图形,所以在作图之前需要先声明图形的种类,然后再按照对应的语法绘图。
1. 流程图(Flowchart)
流程图的声明方式为关键字 graph 加上流程图对应的结构,例如:
graph TD Start --> Stop
声明的就是一种垂直结构的流程图。
graph LR Start --> Stop
声明了一个水平结构的流程图。
可以定义的流程图结构有:
- TB - top bottom:由上到下
- BT - bottom top:由下到上
- RL - right left:从右到左
- LR - left right:从左到右
- TD - top down:由上到下
A. 节点形状 Nodes & shapes
目前Typora支持的节点形状有11种类型。
① 默认节点graph LR id

② 矩形节点
graph LR id1[This is the text in the box]

③ 圆角矩形节点
graph LR id1(This is the text in the box)

④ 圆形节点
graph LR id1((This is the text in the circle))

⑤ 非对称节点
graph LR id1>This is the text in the box]

⑥ 菱形节点
graph LR id1{This is the text in the box}

⑦ 六边形节点
graph LR id1{{This is the text in the box}}

⑧ 平行四边形节点
graph TD id1[/This is the text in the box/]

⑨ 倒平行四边形节点
graph TD id1[\This is the text in the box\]

⑩ 梯形节点
graph TD A[/Christmas\]

⑪ 倒梯形绝点
graph TD B[\Go shopping/]

B. 节点间连线 Links between nodes
目前Typora支持的连接方式有9种类型。
① 单向箭头
graph LR A-->B

② 普通连线
graph LR A --- B

③ 文字连线
graph LR A-- This is the text ---B
或者
graph LR A---|This is the text|B

④ 带文字的单向箭头
graph LR A-->|text|B
或者
graph LR A-- text -->B

⑤ 单向虚线
graph LR; A-.->B;

⑥ 带文字的单向虚线
graph LR A-. text .-> B

⑦ 链式连接
graph LR A -- text --> B -- text2 --> C

⑧ 交叉连接
graph TB A --> C A --> D B --> C B --> D

C. 子图 Subgraphs
子图的格式为:
subgraph title graph definitionend
例如:
graph TB c1-->a2 subgraph one a1-->a2 end subgraph two b1-->b2 end subgraph three c1-->c2 end

D. 样式和类 Styling and Classes
可以使用类似于CSS样式的方式给节点添加一些效果,例如:
graph LR id1(Start)-->id2(Stop) style id1 fill:#f9f,stroke:#333,stroke-width:4px style id2 fill:#bbf,stroke:#f66,stroke-width:2px,color:#fff,stroke-dasharray: 5, 5

或者使用类定义好样式后,用::: 操作符将样式名称与节点关联起来:
graph LR A:::someclass --> B:::otherclass classDef someclass fill:#f9f,stroke:#333,stroke-width:4px; classDef otherclass fil:#f96;

2. 序列图(Sequence Diagrams)
序列图是对对象之间传送消息的时间顺序的可视化表示。如下图中两个人之间的对话就可以用序列图进行表示:
A. 参与者与别名 Participants & Aliases
序列图的声明是sequenceDiagram,其中的参与者(Participants)可以隐式或者显式地定义。无论使用哪种定义方式,参与者在图中的顺序会按照定义的先后顺序出现。例如上图的隐式定义代码为:
sequenceDiagram Alice->>John: Hello John, how are you? John-->>Alice: Great!
如果使用显示定义,需要加入 participant 关键字:
sequenceDiagram participant John participant Alice Alice->>John: Hello John, how are you? John-->>Alice: Great!
然后图中的两人顺序会交换,变为:
如果参与者的名称过长,也可以使用别名(Aliases)的方式进行描述。如上图的代码可以写作:
sequenceDiagram participant A as Alice participant J as John A->>J: Hello John, how are you? J->>A: Great!
B. 消息与激活 Messages & Activations
消息是对象间的一种通信机制。激活表示一个对象直接或通过从属操作完成操作的过程,通常用一个窄长的矩形表示,矩形的高度表示对象存在的过程。
消息的格式通常为:
[Actor][Arrow][Actor]:Message text
目前支持6种形式的箭头:
| 种类 | 描述 |
|---|---|
| -> | 不带箭头的实线 |
| —> | 不带箭头的虚线 |
| ->> | 带箭头的实线 |
| —>> | 带箭头的虚线 |
| -x | 带有x的实线 |
| —x | 带有x的虚线 |
激活和注销都需要明确声明:
sequenceDiagram Alice->>John: Hello John, how are you? activate John John-->>Alice: Great! deactivate John

或者在消息的箭头上加上+/- 来标明,上图的代码可以改写为:
sequenceDiagram Alice->>+John: Hello John, how are you? John-->>-Alice: Great!
激活也可以被同一个对象叠加使用:
sequenceDiagram Alice->>+John: Hello John, how are you? Alice->>+John: John, can you hear me? John-->>-Alice: Hi Alice, I can hear you! John-->>-Alice: I feel great!

C. 批注与注释 Notes & Comments
可以通过使用以下语法来为序列图添加批注便签:
Note [ right of | left of | over ] [Actor]: Text in note content
例如:
sequenceDiagram participant John Note right of John: Text in note

如果想让批注便签涵盖两个参与者:
sequenceDiagram Alice->John: Hello John, how are you? Note over Alice,John: A typical interaction

注释是用于解释代码,增加可读性的文本。注释中的内容会被解析器忽略掉,注释可以用%% 来表示,但需要注意的是注释必须在单独的一行。例如下列代码中的注释就只起到解释代码的作用,并不会在图形中显示:
sequenceDiagram Alice->>John: Hello John, how are you? %% 这是一行不会显示的注释! John-->>Alice: Great!
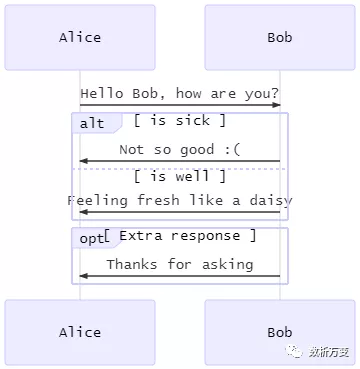
D. 循环与分支 Loops & Alt
因为序列图常常被用在不同进程/线程之间交互的绘制,所以会有类似于for循环和if-else分支的结构描述。
可以使用下面的标记方式描述循环:
loop Loop text... statements ...end
例如:
sequenceDiagram Alice->John: Hello John, how are you? loop Every minute John-->Alice: Great! end

分支结构有两种表示方法,一种类似于if-else:
alt Describing text... statements ...else... statements ...end
另一种则类似于while:
opt Describing text... statements ...end
例如:
sequenceDiagram Alice->>Bob: Hello Bob, how are you? alt is sick Bob->>Alice: Not so good :( else is well Bob->>Alice: Feeling fresh like a daisy end opt Extra response Bob->>Alice: Thanks for asking end
E. 背景高亮 BG Highlighting
使用rgb或者rgba的语法定义颜色后就可以用来高亮相应区域的背景。标记的格式为:
rect rgb(0, 255, 0)... content ...endrect rgba(0, 0, 255, .1)... content ...end

3. 类图(Class Diagrams)
类图是面向对象建模的主要组成部分,显示了模型的静态结构,特别是模型中存在的类、类的内部结构以及它们与其他类的关系等。无论是在面向对象编程还是数据建模,类图都有着很广泛的应用。
上图中Duck、Fish和Zebra都属于Animal这一个类,然后从Animal这个类中可以获得这三种动物的共有属性,并根据各自的类图得知其专有的属性。
mermaid.js中使用类图需要先用classDiagram进行声明,上图的代码如下:
classDiagram Animal <|-- Duck Animal <|-- Fish Animal <|-- Zebra Animal : +int age Animal : +String gender Animal: +isMammal() Animal: +mate() class Duck{ +String beakColor +swim() +quack() } class Fish{ -int sizeInFeet -canEat() } class Zebra{ +bool is_wild +run() }
A. 类及定义方法 Class & Defining
类图的基本组成单元包含三层:
- 顶层主要显示类的名称,以粗体的形式居中,并且首字母为大写,可以含有可选的注释;
- 中间层包含类的属性,左对齐且属性首字母小写,通常属性的字段类型会被标出;
底层包含可以对类执行的操作方法,左对齐且首字母小写,只要在后面加上
()就会被自动归为这层。classDiagram class BankAccount BankAccount : +String owner BankAccount : +Bigdecimal balance BankAccount : +deposit(amount) BankAccount : +withdrawl(amount)

例如上图中,BankAccount是类名,包含两个属性owner和balance,他们数据类型为String和Bigdecimal。可以对这个进行操作的方法有deposit和withdraw,这两种方法操作的过程要带上变量amount。
定义类的方法有两种:使用关键词
class显式地定义,如class Animal;- 使用关系来定义两个类,如
Vehicle <|-- Car。classDiagram class Animal Vehicle <|-- Car

B. 关系及标签 Relationship & Labels
类和对象之间的联系使用逻辑连接符号,语法规则为:
目前支持8种连接关系,如下表:[classA][Arrow][ClassB]:LabelText
| Type | Description |
|---|---|
| <|— | Inheritance |
| *— | Composition |
| o— | Aggregation |
| —> | Association |
| — | Link (Solid) |
| ..> | Dependency |
| ..|> | Realization |
| .. | Link (Dashed) |
将这8种连接关系绘图:
classDiagramclassA <|-- classBclassC *-- classDclassE o-- classFclassG <-- classHclassI -- classJclassK <.. classLclassM <|.. classNclassO .. classP

为上图中的关系加上标签,并改变箭头的方向:
classDiagramclassA --|> classB : InheritanceclassC --* classD : CompositionclassE --o classF : AggregationclassG --> classH : AssociationclassI -- classJ : Link(Solid)classK ..> classL : DependencyclassM ..|> classN : RealizationclassO .. classP : Link(Dashed)

如上所示,关系标签的语法格式为:
[classA][Arrow][ClassB]:LabelText
C. 类注释 Annotations
我们可以在类图中的类名旁边加上注释,来表示该类的自然属性,常见的注释有:
<<Interface>>表明为接口类<<abstract>>表明为抽象类<<Service>>表明为服务类<<enumeration>>表明为枚举类
添加的方式有以下两种:
classDiagram class Shape <<interface>> Shape
classDiagramclass Shape{ <<interface>>noOfVertices draw()}class Color{ <<enumeration>>RED BLUE GREEN WHITE BLACK}

4. 状态图(State Siagrams)
状态图是描述一个实体基于事件反应的动态行为,显示了该实体如何根据当前所处的状态对不同的事件做出反应。
mermaid.js中使用状态图需要先用stateDiagram进行声明,如下图:
stateDiagram [*] --> Still Still --> [*]Still --> Moving Moving --> Still Moving --> Crash Crash --> [*]

上图中存在三个状态:Still、Moving和Crash。其中Still和Moving可以互相转变,Moving可以单向转变为Crash,Still不能直接转变为Crash。
A. 状态与转变 States & Transitions
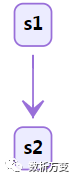
状态类似于一个节点,可以通过以下方式进行定义:
stateDiagram s1
stateDiagram state "This is a state description" as s2
或者:
stateDiagram s2 : This is a state description

转变类似于节点之间的连线/边,使用-->就可以进行表示。转变可以先用于还未定义的状态,然后再对状态进行定义。
stateDiagram s1 --> s2
为转变连线添加文本:
stateDiagram s1 --> s2: A transition

开始和结束是两个两个比较特殊的状态,直接用[*]就可以表示,然后解析器会根据连线箭头的方向判断是开始状态还是结束状态。
stateDiagram [*] --> s1 s1 --> [*]

B. 复合状态 Composite States
状态图的实际应用中经常会碰到一个状态包含多个内部状态,这时我们可以使用复合状态图来表示。只需要使用关键词、id以及{ }将内容嵌套进去就可以了:
stateDiagram [*] --> First state First { [*] --> second second --> [*] }

stateDiagram [*] --> Firststate First { [*] --> Secondstate Second { [*] --> second second --> Thirdstate Third { [*] --> third third --> [*] } } }

stateDiagram [*] --> First First --> Second First --> Thirdstate First { [*] --> fir fir --> [*] } state Second { [*] --> sec sec --> [*] } state Third { [*] --> thi thi --> [*] }

C. 分流与并发 Forks & Concurrency
分流状态图可以使用<<fork>>和<<join>>来进行控制:
stateDiagram state fork_state <<fork>> [*] --> fork_state fork_state --> State2 fork_state --> State3state join_state <<join>> State2 --> join_state State3 --> join_state join_state --> State4 State4 --> [*]

并发状态图可以使用符号--来实现:
stateDiagram [*] --> Activestate Active { [*] --> NumLockOff NumLockOff --> NumLockOn : EvNumLockPressed NumLockOn --> NumLockOff : EvNumLockPressed -- [*] --> CapsLockOff CapsLockOff --> CapsLockOn : EvCapsLockPressed CapsLockOn --> CapsLockOff : EvCapsLockPressed -- [*] --> ScrollLockOff ScrollLockOff --> ScrollLockOn : EvCapsLockPressed ScrollLockOn --> ScrollLockOff : EvCapsLockPressed }

D. 批注与注释 Notes & Comments
状态图中的批注可以使用 right of 或 left of 来设置相对于指定节点的位置:
stateDiagram State1: The state with a note note right of State1 Important information! You can write notes. end note State1 --> State2 note left of State2 : This is the note to the left.

与序列图汇总类似,状态图中添加注释也是通过%% 来实现的,不同的是不一定要在单独的行。
stateDiagram [*] --> Still Still --> [*]%% this is a comment Still --> Moving Moving --> Still %% another comment Moving --> Crash Crash --> [*]
5. 甘特图(Gantt Diagrams)
甘特图是一种用来显示项目进展横向条形图,mermaid.js中使用甘特图图需要先用gantt进行声明,如下图:
gantt title A Gantt Diagram dateFormat YYYY-MM-DD section Section A task :a1, 2014-01-01, 30d Another task :after a1 , 20d section Another Task in sec :2014-01-12 , 12d another task : 24d

甘特图中默认的时间格式为 YYYY-MM-DD,可以通过关键词 dateFormat自定义时间格式。
dateFormat YYYY MM DD
相应的时间格式设置可以参考:
https://momentjs.com/docs/#/parsing/string-format/
甘特图中添加注释也是通过%% 来实现的。
6. 饼图(Pie Chart)
mermaid.js中使用饼图需要先用pie进行声明,如下图:
pie title Pets adopted by volunteers "Dogs" : 386 "Cats" : 85 "Rats" : 15

mermaid.js中饼图的语法十分简单:
[pie] [title] [titlevalue] (OPTIONAL)"[datakey1]" : [dataValue1]"[datakey2]" : [dataValue2]"[datakey3]" : [dataValue3]..
- 以关键字
pie开头声明。 - 然后跟着关键字
title和一个字符串作为饼图的标题(此项为可选)。 - 然后就是数据集
"label"标明饼图中类别的标签名;- 冒号
:作为标签和值的分隔符; - 冒号后面的值会被自动计算为饼图中的比例,必须为正。
Ⅲ. mermaid.js实例
1. 流程图(Flowchart)
graph TD; A-->B; A-->C; B-->D; C-->D;

graph TDA[Hard] -->|Text| B(Round)B --> C{Decision}C -->|One| D[Result 1]C -->|Two| E[Result 2]

给流程图添加标题的方法:
graph TDtitle[<u>My Title</u>]title-->FirstStepstyle title fill:#FFF,stroke:#FFFlinkStyle 0 stroke:#FFF,stroke-width:0;FirstStep-->...

graph LR subgraph This is my caption A --> B end

在文本中添加新行的方法:
graph TDa-- 很长的第一行<br>很长的第二行 --> bsubgraph BEHAVIOUR e-- 很长的第三行<br>很长的第四行 --> fend

改变流程图曲线样式的方法:
graph TD %% Set edges to be curved (try monotoneX for a nice alternative) linkStyle default interpolate basis A[Christmas] -->|Get money| B(Go shopping) B --> C{Let me think} C -->|One| D[Laptop] C -->|Two| E[iPhone] C -->|Three| F[fa:fa-car Car]

2. 序列图(Sequence Diagrams)
sequenceDiagramAlice->>John: Hello John, how are you?loop Healthcheck John->>John: Fight against hypochondriaendNote right of John: Rational thoughts!John-->>Alice: Great!John->>Bob: How about you?Bob-->>John: Jolly good!

sequenceDiagram participant Alice participant Bob Alice->>John: Hello John, how are you? loop Healthcheck John->>John: Fight against hypochondria end Note right of John: Rational thoughts <br/>prevail! John-->>Alice: Great! John->>Bob: How about you? Bob-->>John: Jolly good!

sequenceDiagram Alice ->> Bob: Hello Bob, how are you? Bob-->>John: How about you John? Bob--x Alice: I am good thanks! Bob-x John: I am good thanks! Note right of John: Bob thinks a long<br/>long time, so long<br/>that the text does<br/>not fit on a row.Bob-->Alice: Checking with John... Alice->John: Yes... John, how are you?

3. 类图(Class Diagrams)
classDiagramClass01 <|-- AveryLongClass : Cool<<interface>> Class01Class09 --> C2 : Where am i?Class09 --* C3Class09 --|> Class07Class07 : equals()Class07 : Object[] elementDataClass01 : size()Class01 : int chimpClass01 : int gorillaclass Class10 { <<service>> int id size()}

classDiagramClass01 <|-- AveryLongClass : CoolClass03 *-- Class04Class05 o-- Class06Class07 .. Class08Class09 --> C2 : Where am i?Class09 --* C3Class09 --|> Class07Class07 : equals()Class07 : Object[] elementDataClass01 : size()Class01 : int chimpClass01 : int gorillaClass08 <--> C2: Cool label

4. 甘特图(Gantt Diagrams)
gantt dateFormat YYYY-MM-DD title Adding GANTT diagram functionality to mermaidsection A section Completed task :done, des1, 2014-01-06,2014-01-08 Active task :active, des2, 2014-01-09, 3d Future task : des3, after des2, 5d Future task2 : des4, after des3, 5dsection Critical tasks Completed task in the critical line :crit, done, 2014-01-06,24h Implement parser and jison :crit, done, after des1, 2d Create tests for parser :crit, active, 3d Future task in critical line :crit, 5d Create tests for renderer :2d Add to mermaid :1dsection Documentation Describe gantt syntax :active, a1, after des1, 3d Add gantt diagram to demo page :after a1 , 20h Add another diagram to demo page :doc1, after a1 , 48hsection Last section Describe gantt syntax :after doc1, 3d Add gantt diagram to demo page :20h Add another diagram to demo page :48h

5. 饼图(Pie Chart)
pie title Key elements in Product X "Calcium" : 42.96 "Potassium" : 50.05 "Magnesium" : 10.01 "Iron" : 5

Ⅳ. 总结
回顾链接:Markdown最新作图指南(上)
这两篇文章较为全面地介绍了在Markdown编辑器中使用flowchart.js和mermaid.js绘制各类图形,基本上涵盖了所有能找到的资料。
由于两个项目更新较快,其中的一些issue还未关闭,所以可能会存在少量bug。不过文章中的代码我都在最新版本的Typora(Version 0.9.86)中测试使用过,可放心使用。
如果有Markdown的基础,相信只需要花一点点时间就可以掌握这种风格的作图方式。
欢迎关注我的公众号“数析万变”,原创技术观点第一时间推送。

若有收获,就点个赞吧
0 人点赞
