
介绍
在这篇文章中,我将展示常见基础设施的 Prometheus exporters 列表,这些指标采集器在我们创建监控时非常有用。我还将提供指向可用于呈现数据的 Grafana 仪表盘的链接。
系统基本信息
Linux Servers:
- Exporter
https://github.com/prometheus/node_exporter
- Dashboard
https://grafana.com/grafana/dashboards/1860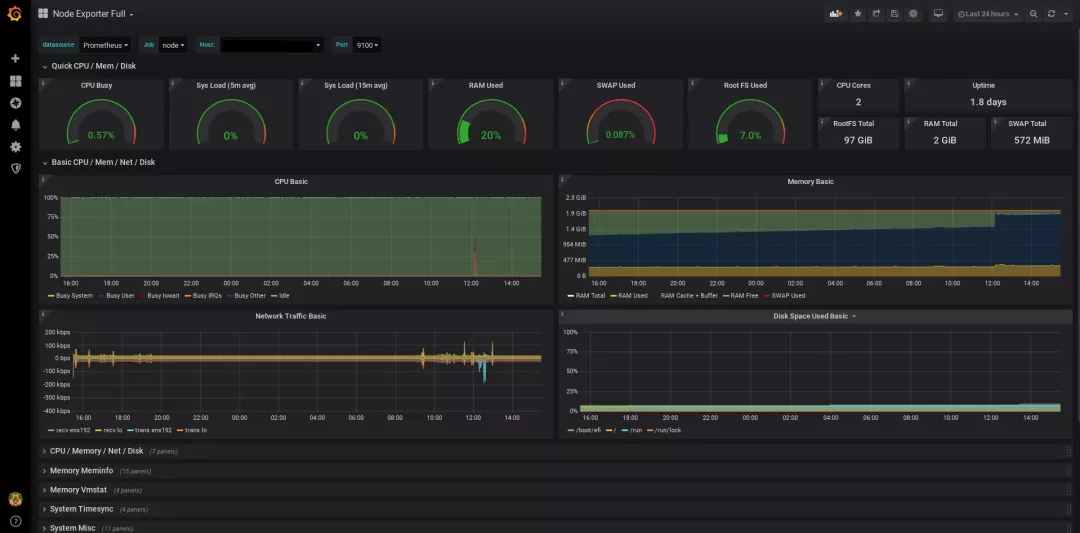
Windows Servers:
- Exporter
https://github.com/prometheus-community/windows_exporter
- Dashboard
https://grafana.com/grafana/dashboards/12422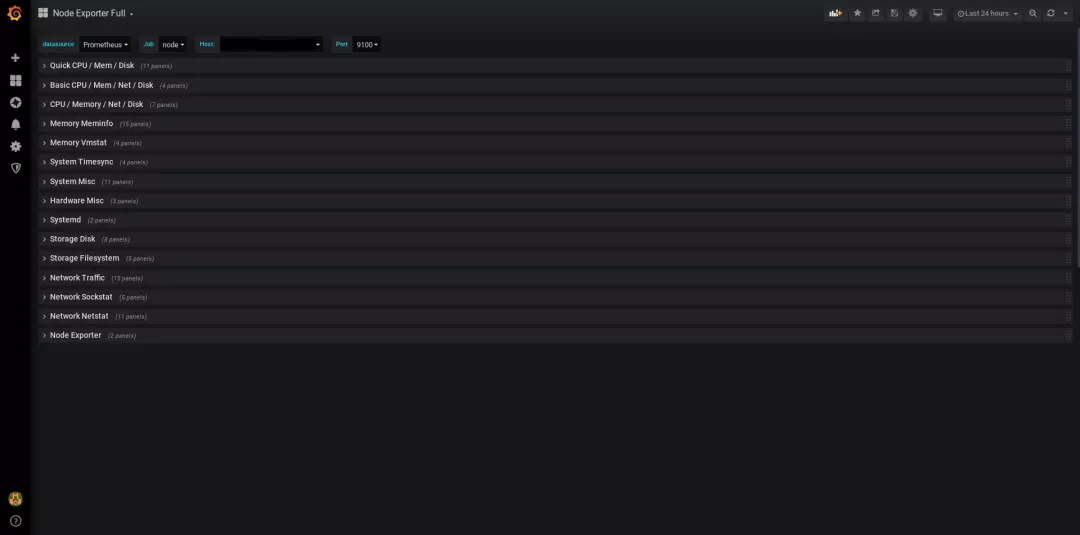
web端服务器
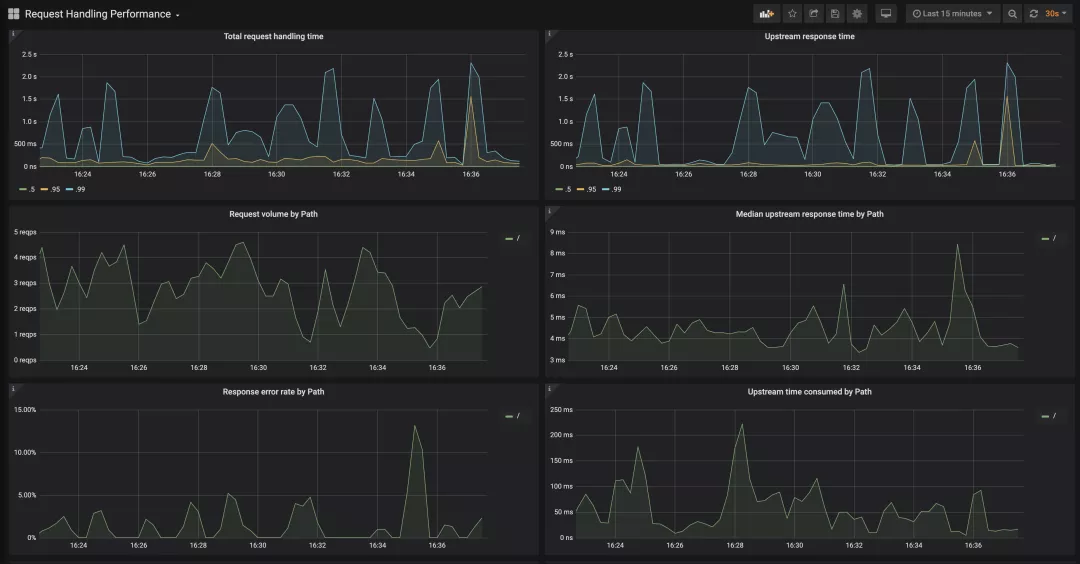
Nginx Server:
收集有关 NGINX 或 NGINX Plus 的信息
- Exporter
https://github.com/nginxinc/nginx-prometheus-exporter
- Dashboard
https://grafana.com/grafana/dashboards/9614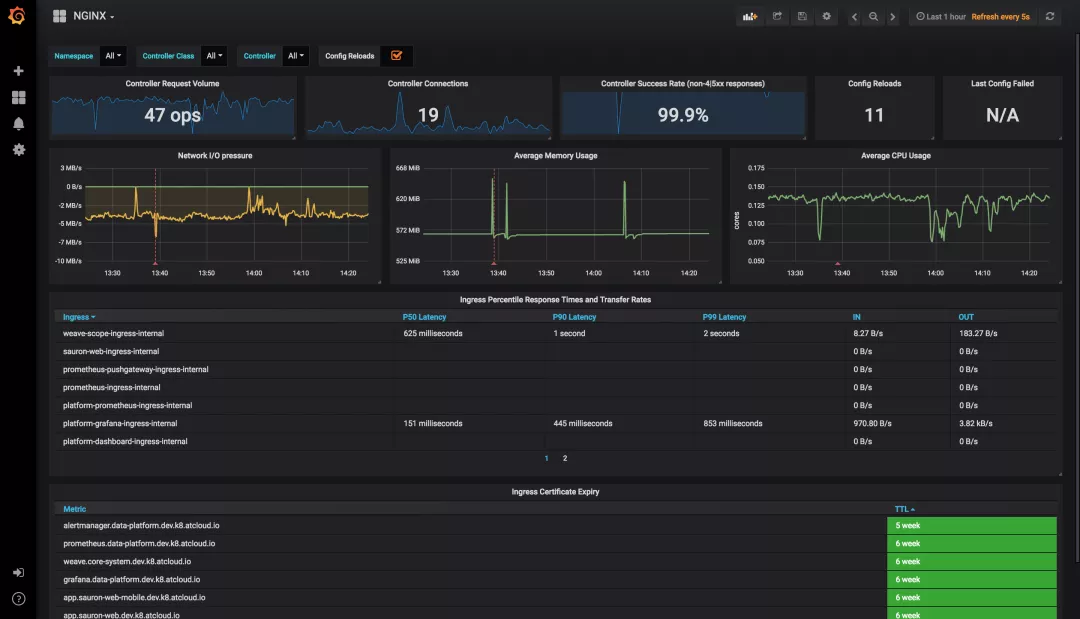

Apache Server:
收集有关 Apache 服务相关信息
- Exporter
https://github.com/Lusitaniae/apache_exporter
- Dashboard
https://grafana.com/grafana/dashboards/3894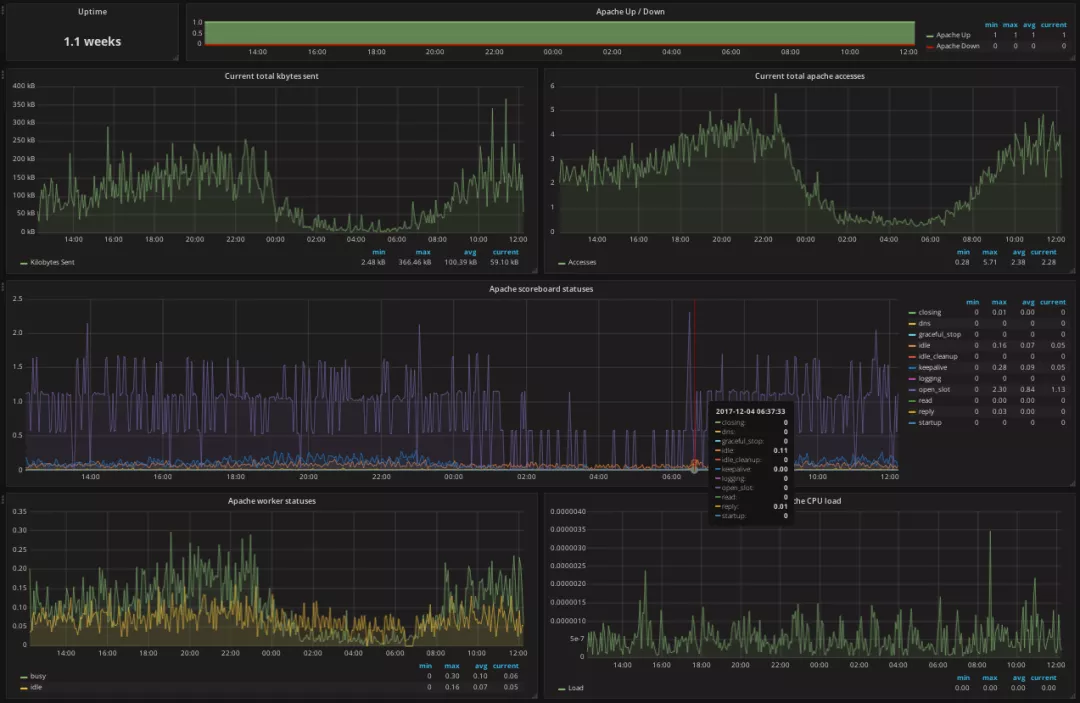
BlackBox Exporter:
收集HTTP、TCP等信息,有利于监控Web服务的生命周期。
- Exporter
https://github.com/prometheus/blackbox_exporter
- Dashboard
https://grafana.com/grafana/dashboards/7587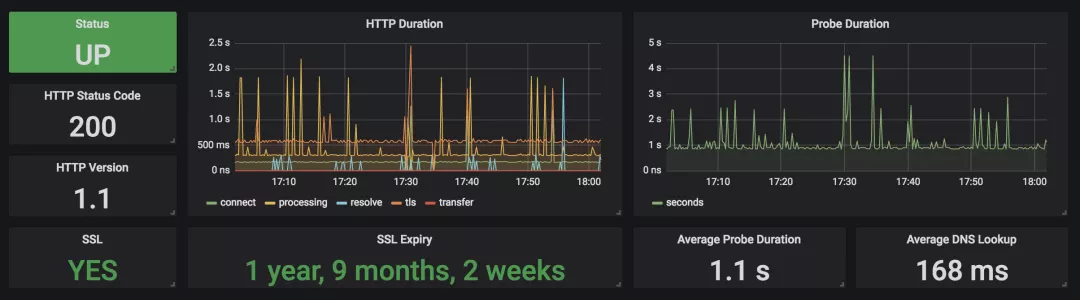


SSL info Exporter:
发送有关用于 Web 服务器的 SSL 证书的信息。适用于监控 SSL 证书的到期日期。
- Exporter
https://github.com/ribbybibby/ssl_exporter
- Dashboard
https://grafana.com/grafana/dashboards/13230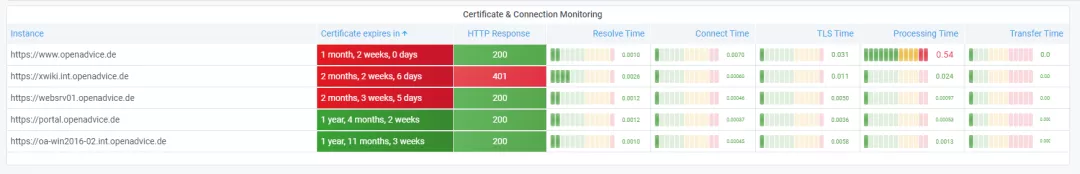
数据库服务器:
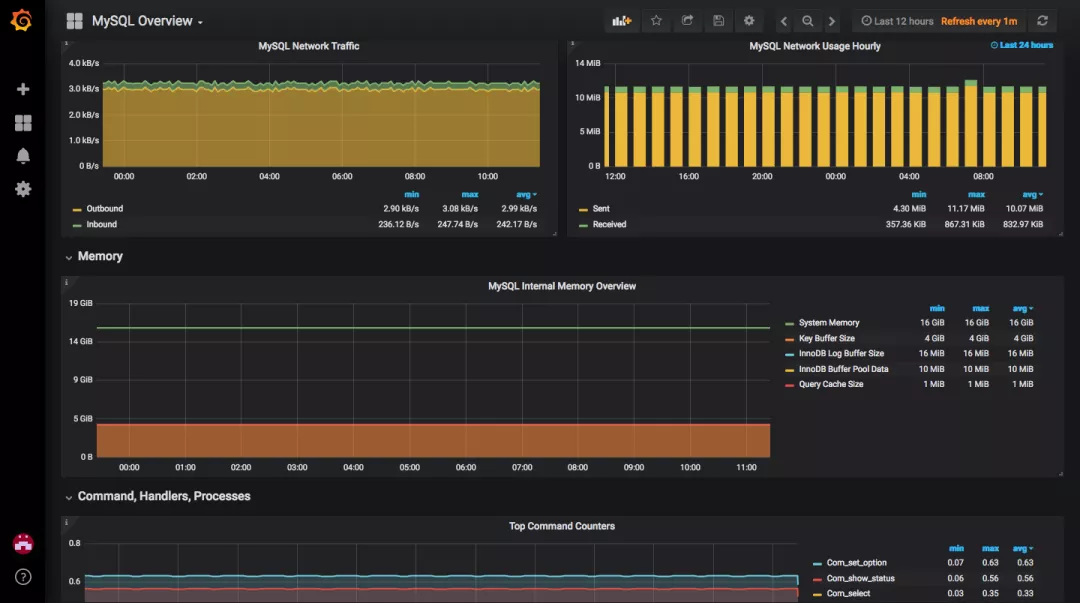
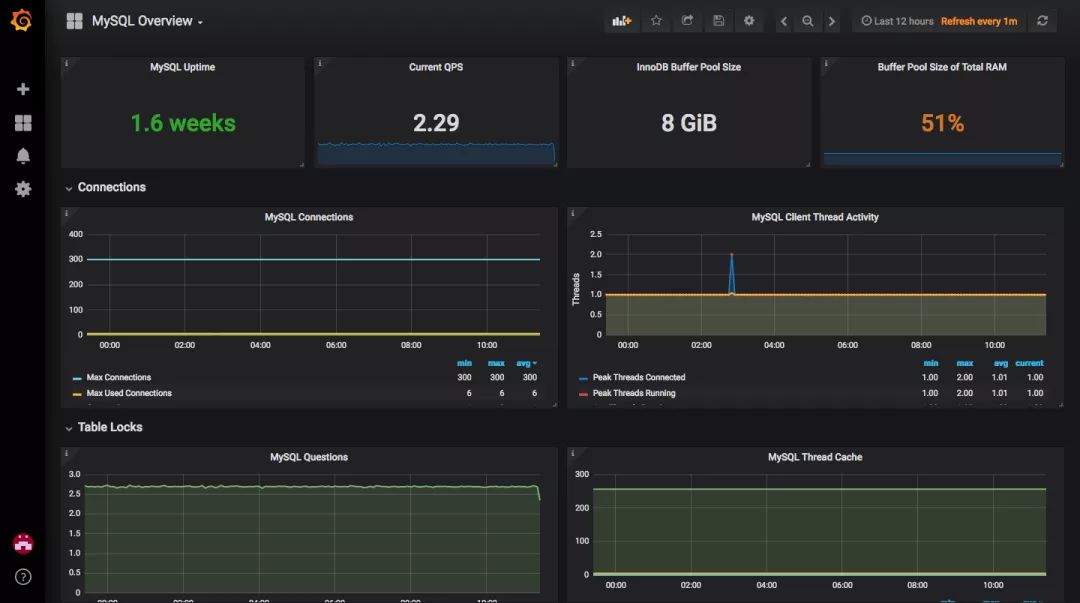
MySQL Server:
收集 MySQL 服务器信息
- Exporter
https://github.com/prometheus/mysqld_exporter
- Dashboard
https://grafana.com/grafana/dashboards/7362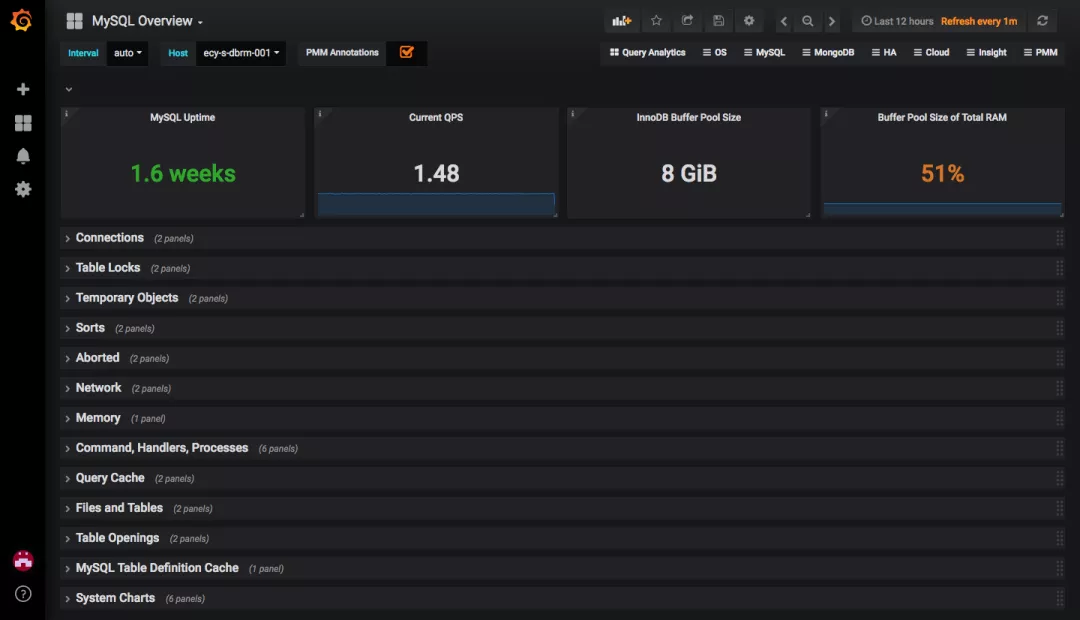

PostgreSQL Server:
收集 PostgreSQL 服务器信息
- Exporter
https://github.com/prometheus-community/postgres_exporter
- Dashboard
https://grafana.com/grafana/dashboards/455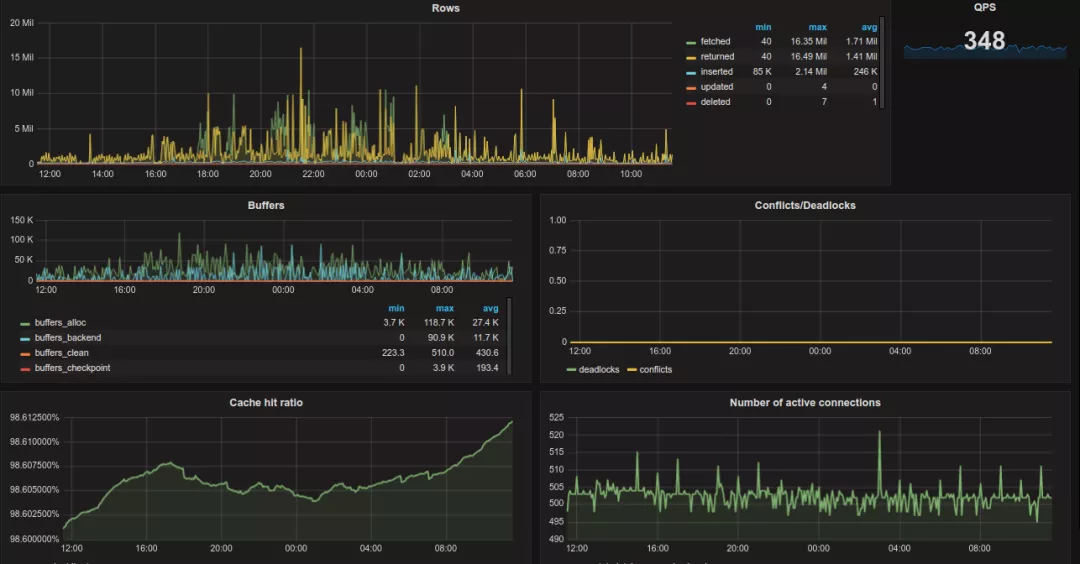
REDIS:
收集 REDIS 服务器信息
- Exporter
https://github.com/oliver006/redis_exporter
- Dashboard
https://grafana.com/grafana/dashboards/11835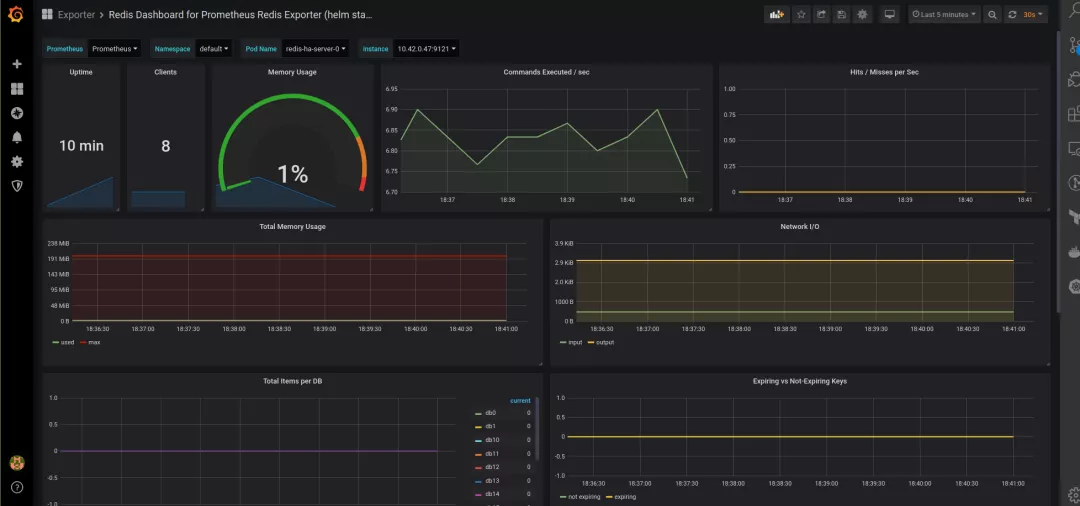
Oracle Database:
收集 Oracle 服务器信息
- Exporter
https://github.com/iamseth/oracledb_exporter
- Dashboard
https://grafana.com/grafana/dashboards/3333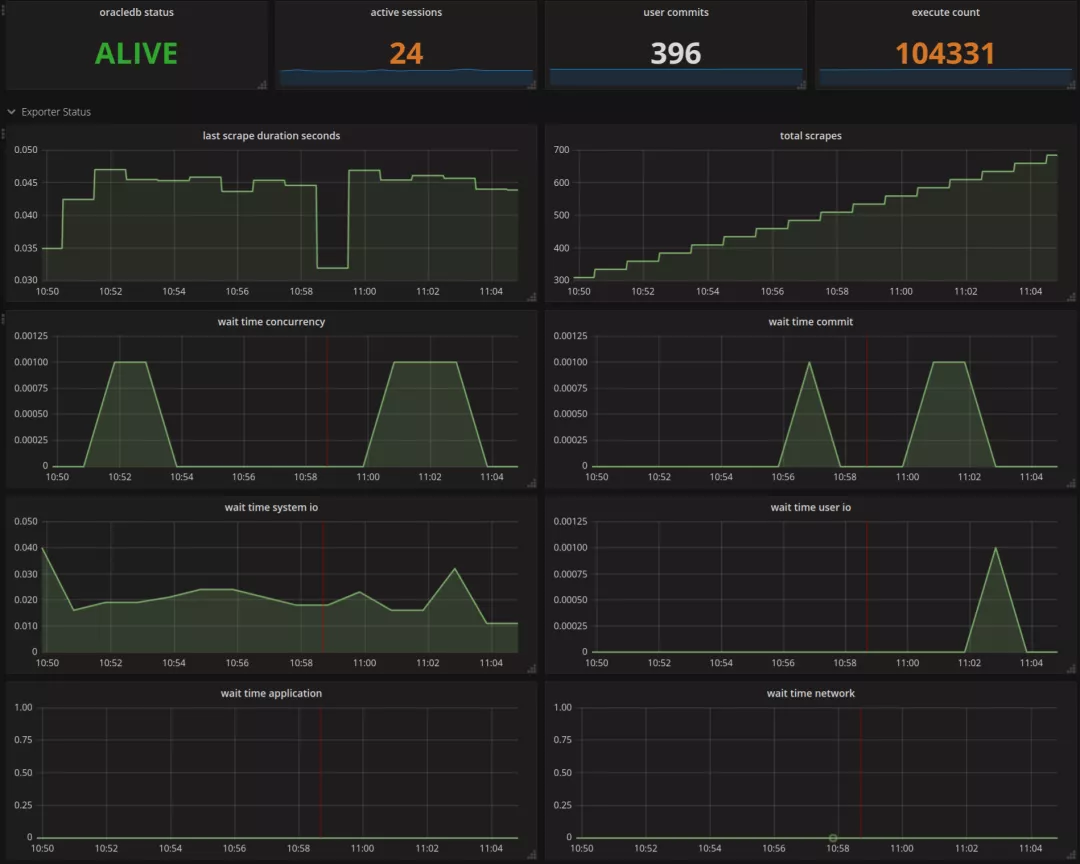
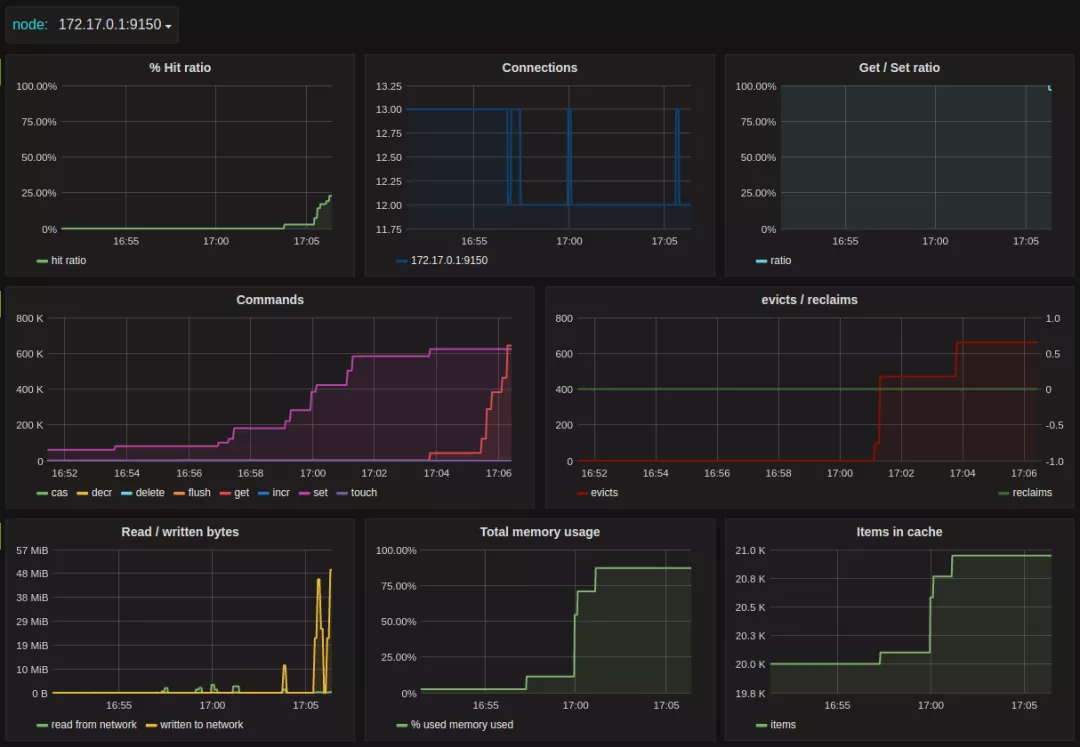
Memcached
收集 Memcached 服务器信息
- Exporter
https://github.com/prometheus/memcached_exporter
- Dashboard
https://grafana.com/grafana/dashboards/37
Elasticsearch:
收集 Elasticsearch 搜索引擎服务信息
- Exporter
https://github.com/prometheus-community/elasticsearch_exporter
- Dashboard

若有收获,就点个赞吧
0 人点赞
