概述
Prometheus和Grafana部署完成后,网络正常,配置文件正常。
抓取agent运行正常,Prometheus内的targets列表内都是全绿;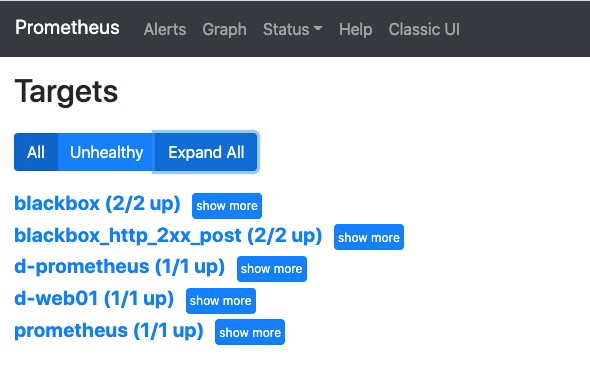
获取监控端口数据正常,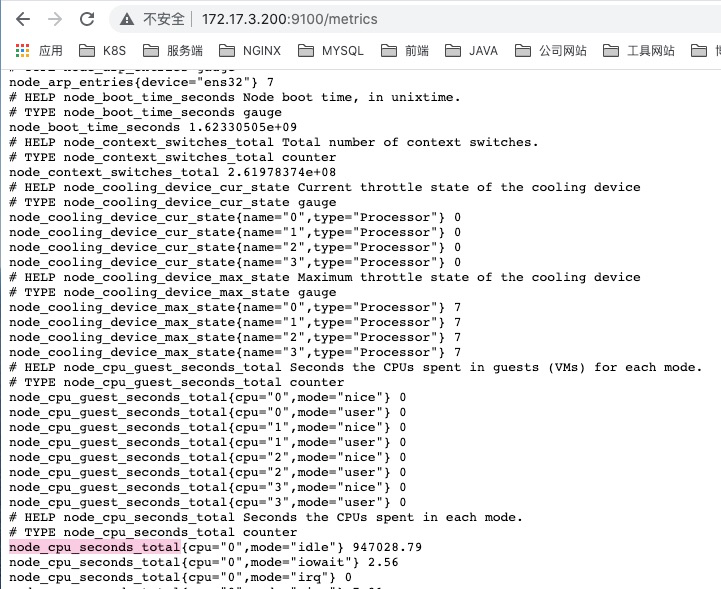
甚至,Grafana数据源配置也是全绿;
但是Prometheus查询界面(在Windows的浏览器上)无法查询出数据,Grafan展示页面(在Windows的浏览器上)也不显示相关的监控曲线和数据。
prometheus搜索指标显示No datapoints found或者Grafana上显示都是N/A。
排查与异常
排查Prometheus agent运行状态, Prometheus Server运行状态, Grafana Sever运行状态,一切正常,网络正常,curl获取数据正常;
结果发现是用来打开Prometheus web界面和Grafana web界面的机器上的时间是西五区,并不是东八区。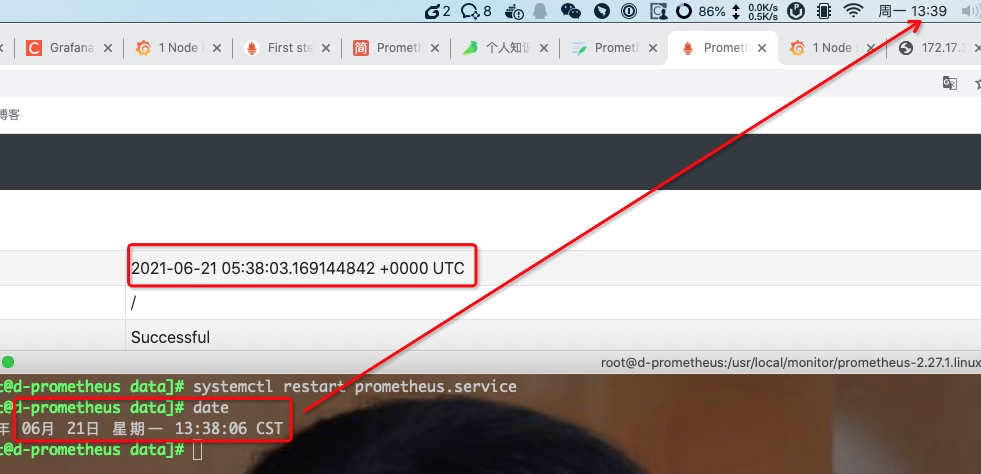
将该机器上的时间调整为东八区后,Prometheus web的查询和Grafana web展示一切恢复正常。
总结
Prometheus监控各个节点对时间要求严格,在部署服务之前务必将所有机器的时间进行同步,包括用来展示和查询的机器。
补充:
今天内网服务器重启,时间未能同步,手动同步后,重启prometheus,grafana,查询grafana时,仍然没有数据,所有的软件都重新安装了,但是仍然没有数据显示,偶然发现/data目录下面几个文件,创建时间和服务启动时间很接近,而且上面的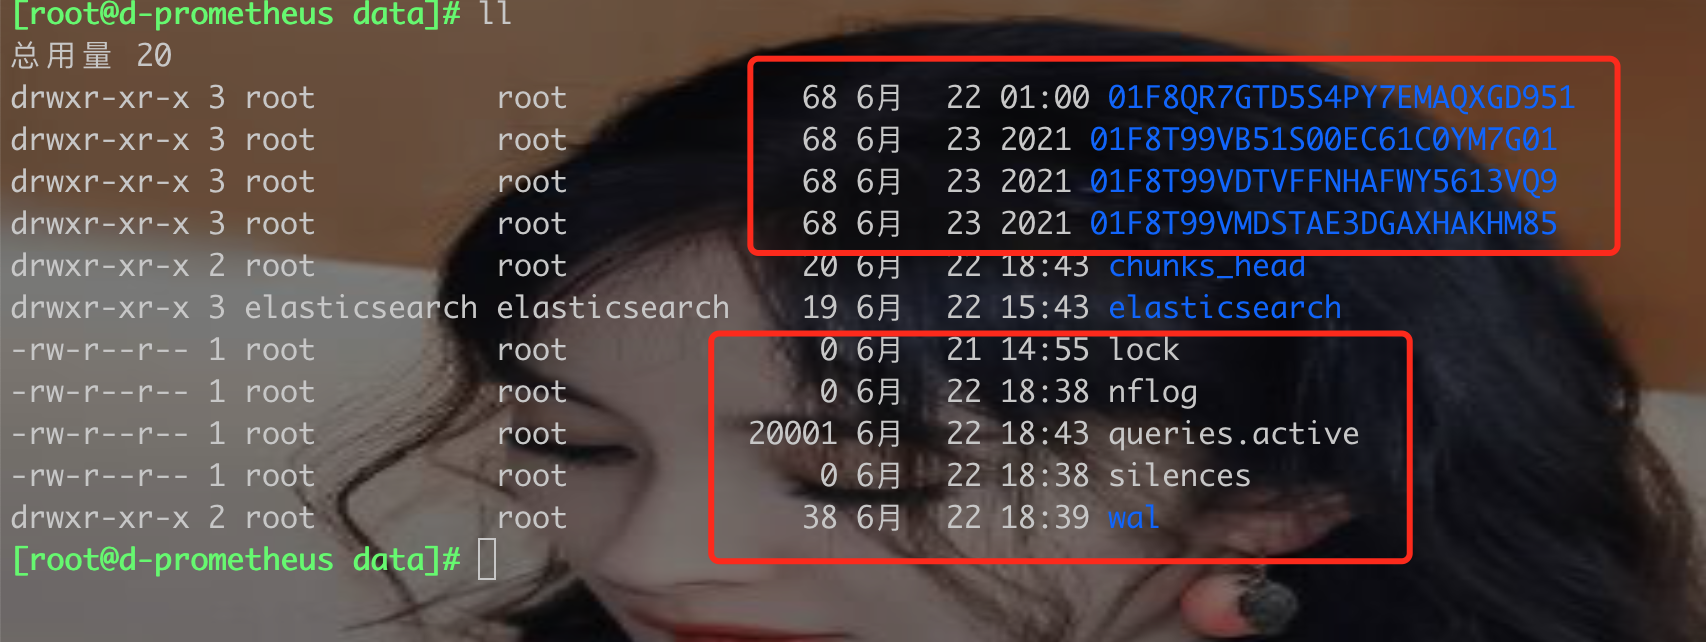
几个文件夹的数据和监控数据有关系,尝试删除,重新启动prometheus服务后,果然,数据显示出来了。
由此可见,grafana和prometheus的数据保存在本地硬盘上,再次启动的时候还会继续加载过去的数据。
为了解决这个服务器重启,时间不同步导致的promethues没有数据的问题,可以安装ntpd服务,然后加入开机启动,
systemctl enable ntpdate.service
然后prometheus依赖于nptdate服务,
[Unit]Description=prometheusAfter=ntpd.service #依赖于nptd服务,ntpd服务启动不成功,则不启动prometheus[Service]Type=simpleUser=rootExecStart=/usr/local/monitor/prometheus-2.27.1.linux-amd64/prometheus --config.file=/usr/local/monitor/prometheus-2.27.1.linux-amd64/prometheus.ymlRastart=on-failure[Install]WantedBy=multi-user.target

若有收获,就点个赞吧
0 人点赞
