blackbox_exporter又称黑盒测试,可以提供 http、dns、tcp、icmp 的监控数据采集,SSL证书过期时间采集等。
安装blackbox_exporter
#1、部署blackbox_exporter
官方下载网址:https://prometheus.io/download/
mkdir /usr/local/monitor/ && cd /usr/local/monitor/wget https://github.com/prometheus/blackbox_exporter/releases/download/v0.19.0/blackbox_exporter-0.19.0.linux-amd64.tar.gztar xf blackbox_exporter-0.19.0.linux-amd64.tar.gz
#2、通过systemctl管理blackbox_exporter
#增加系统管理软件文件vim/etc/systemd/system/blackbox_exporter.service[Unit]Description=blackbox_exporterAfter=network.target[Service]Type=simpleUser=rootExecStart=/usr/local/monitor/blackbox_exporter-0.19.0.linux-amd64/blackbox_exporter --config.file=/usr/local/monitor/blackbox_exporter-0.19.0.linux-amd64/blackbox.ymlRastart=on-failure[Install]WantedBy=multi-user.target
#3、重新加载配置,启动服务
systemctl daemon-reloadsystemctl restart blackbox_exporter.servicesystemctl enable blackbox_exporter.service
配置prometheus
ref:https://github.com/prometheus/blackbox_exporter
需要根据情况在prometheus.yml配置文件中添加下面配置
http测试(监控网站状态)
scrape_configs:- job_name: 'web_status'metrics_path: /probeparams:module: [http_2xx] # Look for a HTTP 200 response.static_configs:- targets:- http://prometheus.io # Target to probe with http.- https://prometheus.io # Target to probe with https.- http://example.com:8080 # Target to probe with http on port 8080.relabel_configs:- source_labels: [__address__]target_label: __param_target- source_labels: [__param_target]target_label: instance- target_label: __address__replacement: 127.0.0.1:9115 # The blackbox exporter's real hostname:port.
- 手动测试
手动访问 http_2xx 这个模板(在blackbox.yml配置文件中执行的),判断 域名http://example.com:8080是否能访问
curl http://127.0.0.1:9115/probe?target=http://example.com:8080&module=http_2xx&debug=true
icmp测试(监控主机存活状态)
scrape_configs:- job_name: 'node_status'metrics_path: /probeparams:module: [icmp]static_configs:- targets: ['10.165.94.31']labels:instance: node_statusgroup: 'node'relabel_configs:- source_labels: [__address__]target_label: __param_target- source_labels: [__param_target]target_label: instance- target_label: __address__replacement: 127.0.0.1:9115 # The blackbox exporter's real hostname:port.
tcp测试(监控主机端口存活状态)
scrape_configs:- job_name: 'port_status'metrics_path: /probeparams:module: [tcp_connect]static_configs:- targets: ['172.19.155.133:8765']labels:instance: 'port_status'group: 'tcp'relabel_configs:- source_labels: [__address__]target_label: __param_target- source_labels: [__param_target]target_label: instance- target_label: __address__replacement: 127.0.0.1:9115 # The blackbox exporter's real hostname:port.
post测试(接口联通性)
scrape_configs:- job_name: 'blackbox_http_2xx_post'scrape_interval: 10smetrics_path: /probeparams:module: [http_post_2xx_query]static_configs:- targets:- https://xx.xxx.com/api/xx/xx/fund/query.actionlabels:group: 'Interface monitoring'relabel_configs:- source_labels: [__address__]target_label: __param_target- source_labels: [__param_target]target_label: instance- target_label: __address__replacement: 127.0.0.1:9115 # The blackbox exporter's real hostname:port.
配置blackbox_exporter 图表
在grafana网站上搜索一个 blackbox_exporter 的图表,此处我选择的是 7587;然后import进入prometheus grafana
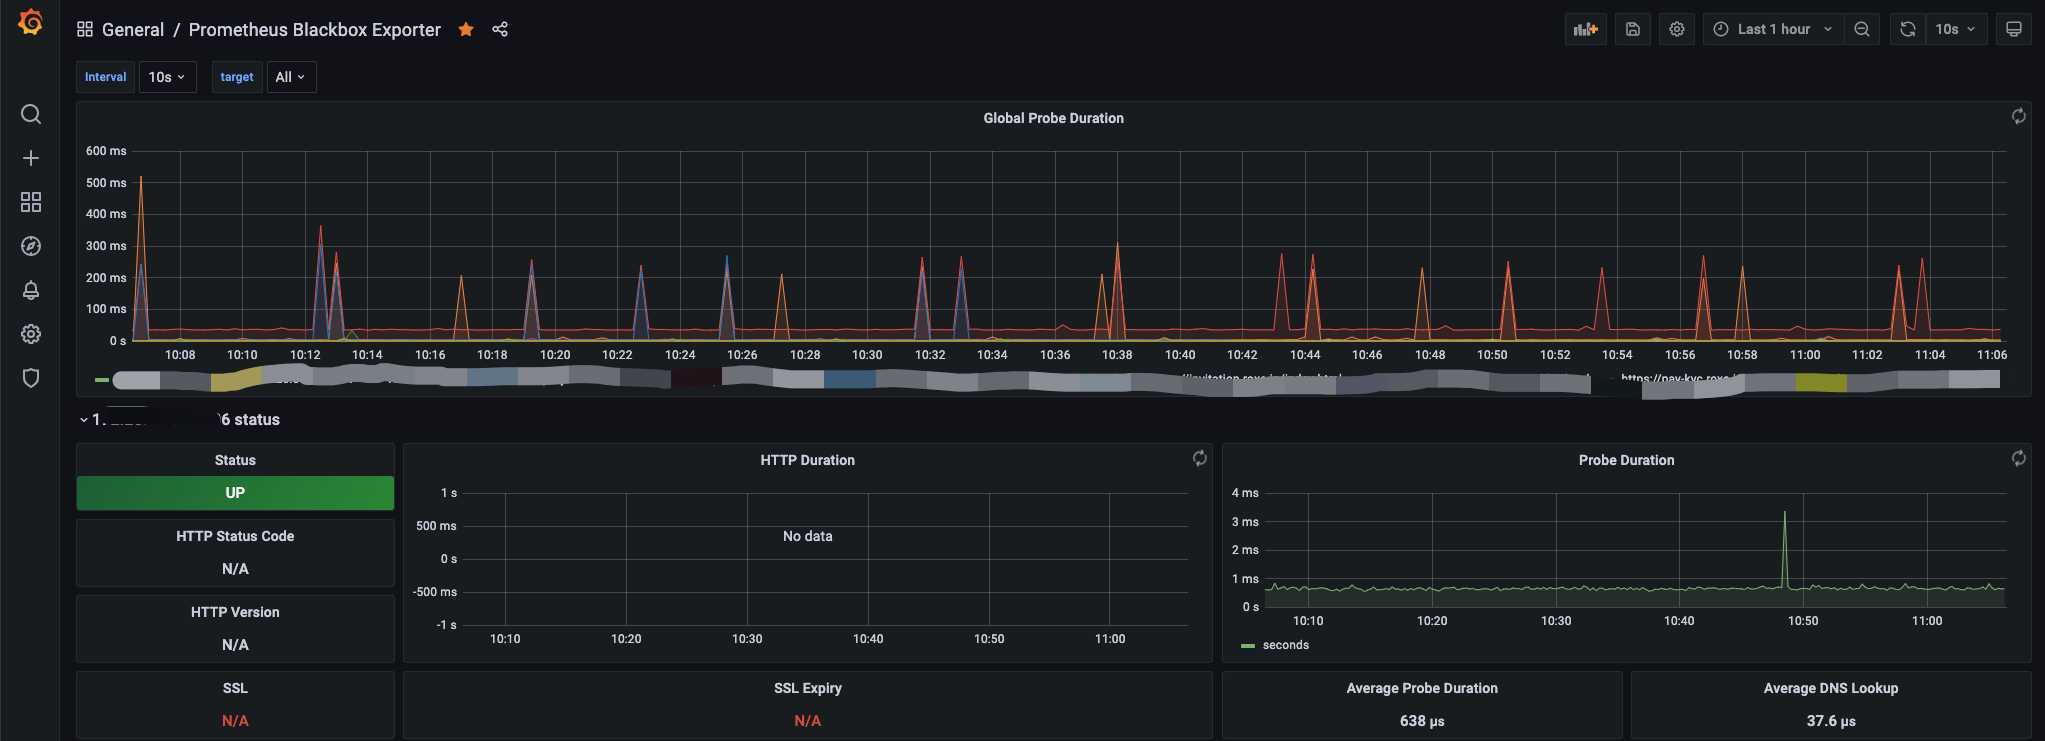
从图标中可以看出请求的URL的状态,状态码,SSL状态,请求的平均返回时间等信息。

若有收获,就点个赞吧
0 人点赞
