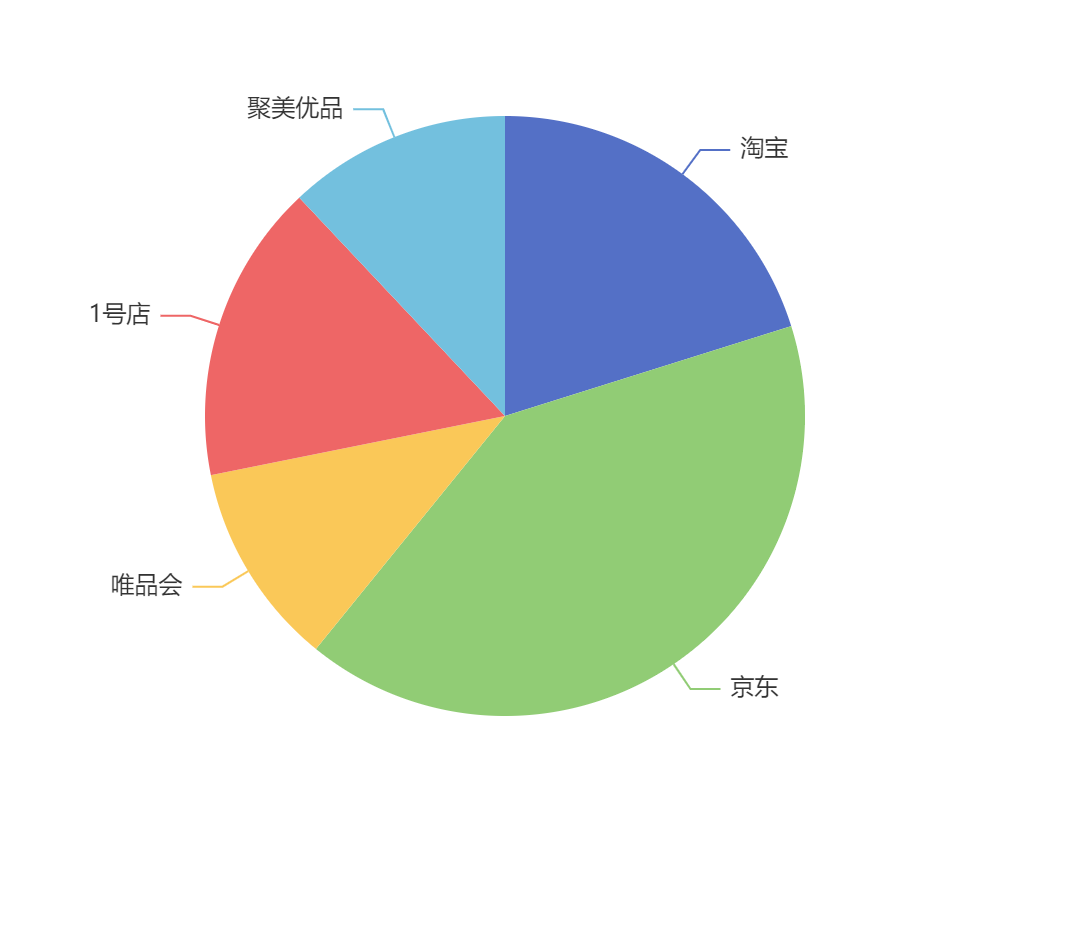
饼图的数据是由 name 和 value 组成的字典所形成的数组 饼图无须配置 xAxis 和 yAxis 饼图可以很好地帮助用户快速了解不同分类的数据的占比情况
基本使用
<!DOCTYPE html><html lang="en"><head><meta charset="UTF-8"><meta http-equiv="X-UA-Compatible" content="IE=edge"><meta name="viewport" content="width=device-width, initial-scale=1.0"><title>Document</title><script src="../js/echarts.js"></script></head><body><div style="width: 600px;height:400px"></div><script> var mCharts = echarts.init(document.querySelector("div"))// 准备数据var pieData = [{ value: 11231, name: "淘宝", }, { value: 22673, name: "京东" }, { value: 6123, name: "唯品会" }, { value: 8989, name: "1号店" }, { value: 6700, name: "聚美优品" }]// 准备配置项 在 series 下设置 type:pievar option = { series: [ { type: 'pie', data: pieData } ] }mCharts.setOption(option)</script></body></html>
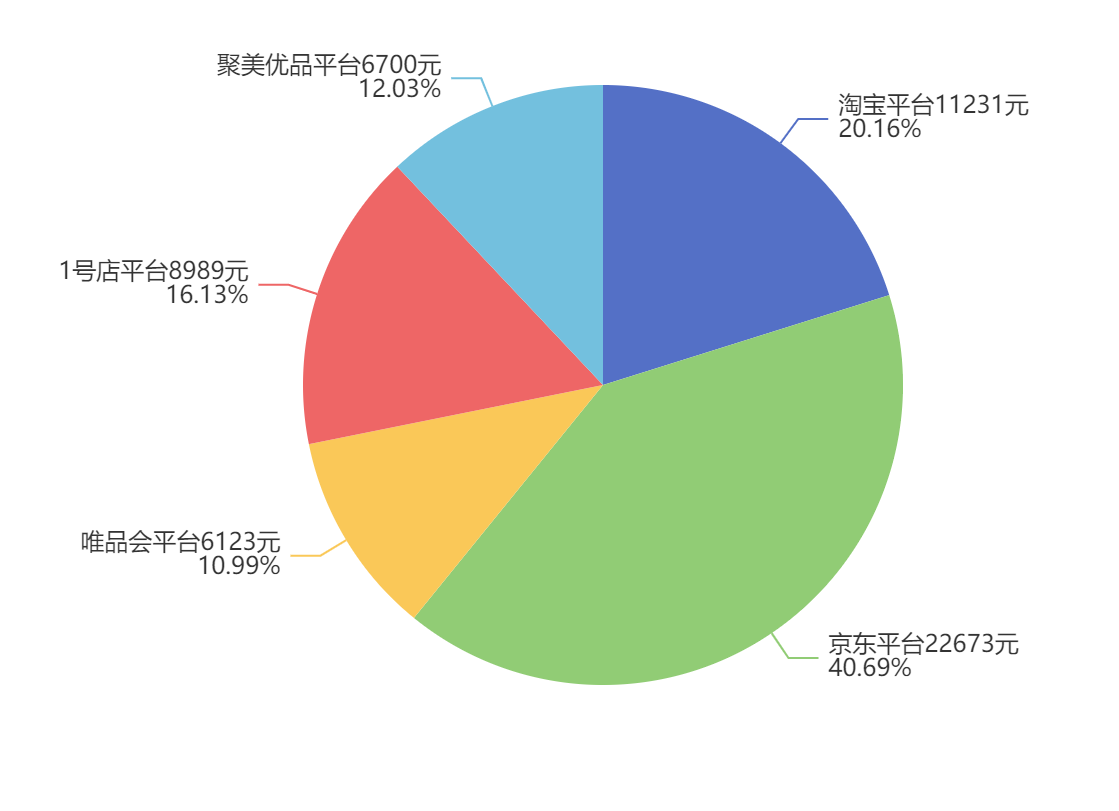
饼图的常见效果
<!DOCTYPE html><html lang="en"><head><meta charset="UTF-8"><meta http-equiv="X-UA-Compatible" content="IE=edge"><meta name="viewport" content="width=device-width, initial-scale=1.0"><title>Document</title><script src="../js/echarts.js"></script></head><body><div style="width: 600px;height:400px"></div><script> var mCharts = echarts.init(document.querySelector("div"))// 准备数据var pieData = [{ value: 11231, name: "淘宝", }, { value: 22673, name: "京东" }, { value: 6123, name: "唯品会" }, { value: 8989, name: "1号店" }, { value: 6700, name: "聚美优品" }]// 准备配置项 在 series 下设置 type:pievar option = {series: [{type: 'pie', data: pieData,label: {// label.show : 显示文字// label.formatter : 格式化文字show: true,formatter: function (arg) { return arg.data.name + '平台' + arg.data.value + '元\n' + arg.percent + '%' }}}]}mCharts.setOption(option)</script></body></html>
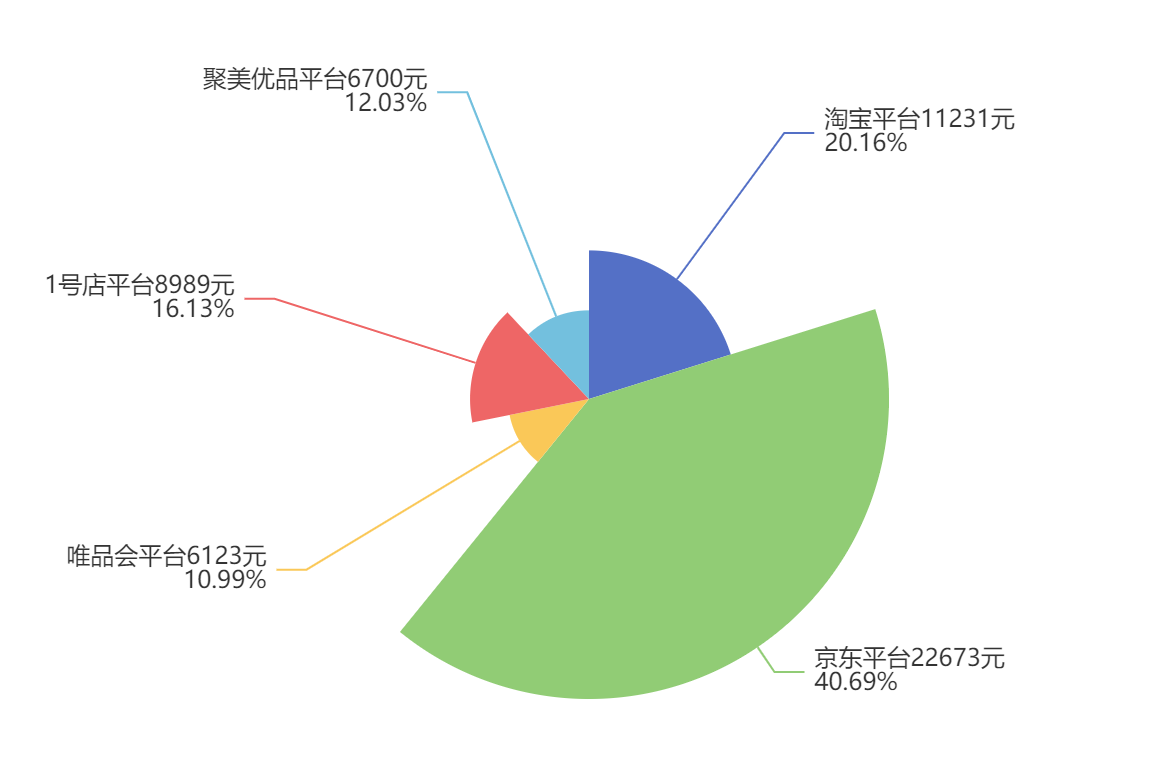
南丁格尔图
南丁格尔图指的是每一个扇形的半径随着数据的大小而不同, 数值占比越大, 扇形的半径也就越大
var option = {series: [{type: 'pie', data: pieData,label: {// label.show : 显示文字// label.formatter : 格式化文字show: true,formatter: (arg)=> { return arg.data.name + '平台' + arg.data.value + '元\n' + arg.percent + '%'}}, roseType: 'radius'}]}
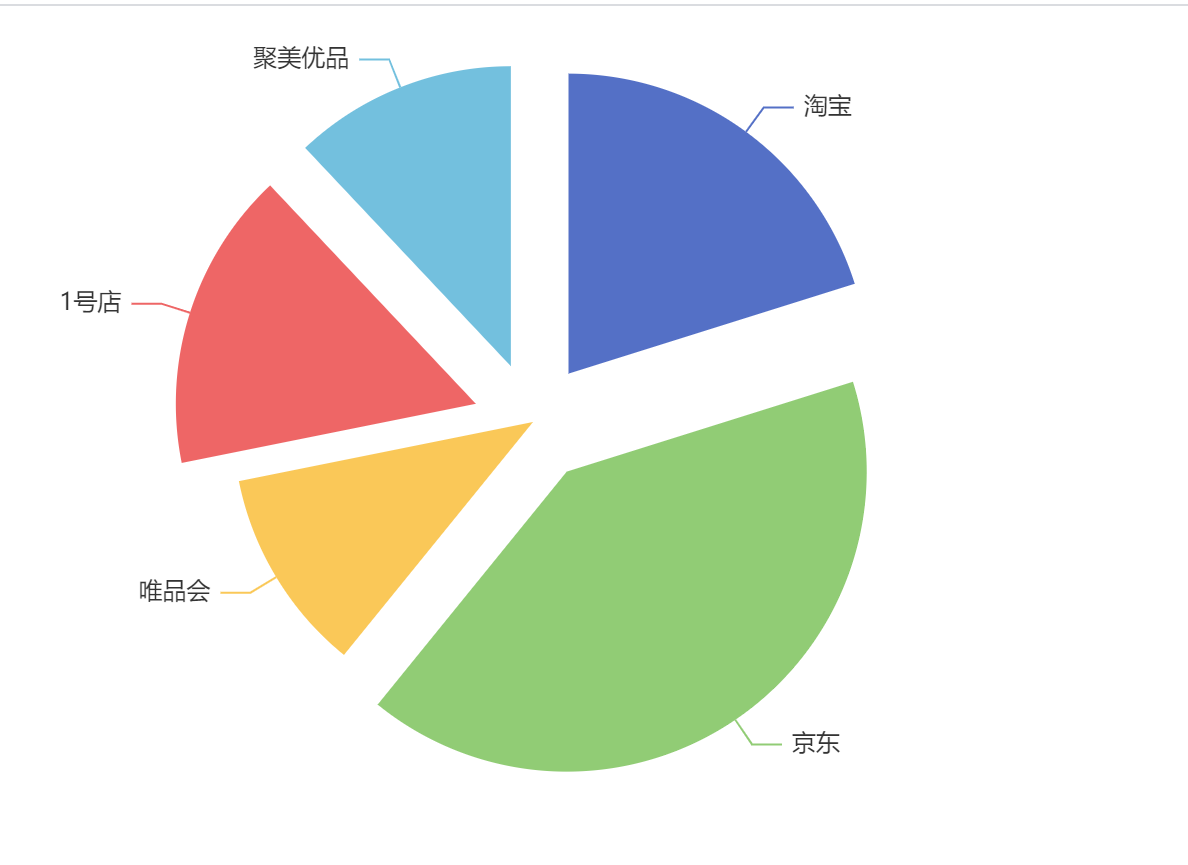
选中效果
selectedMode: ‘multiple’ 选中模式,表示是否支持多个选中,默认关闭,支持布尔值和字符串,字符串取值可 选 ‘single’ , ‘multiple’ ,分别表示单选还是多选 selectedOffset: 30 选中扇区的偏移距离
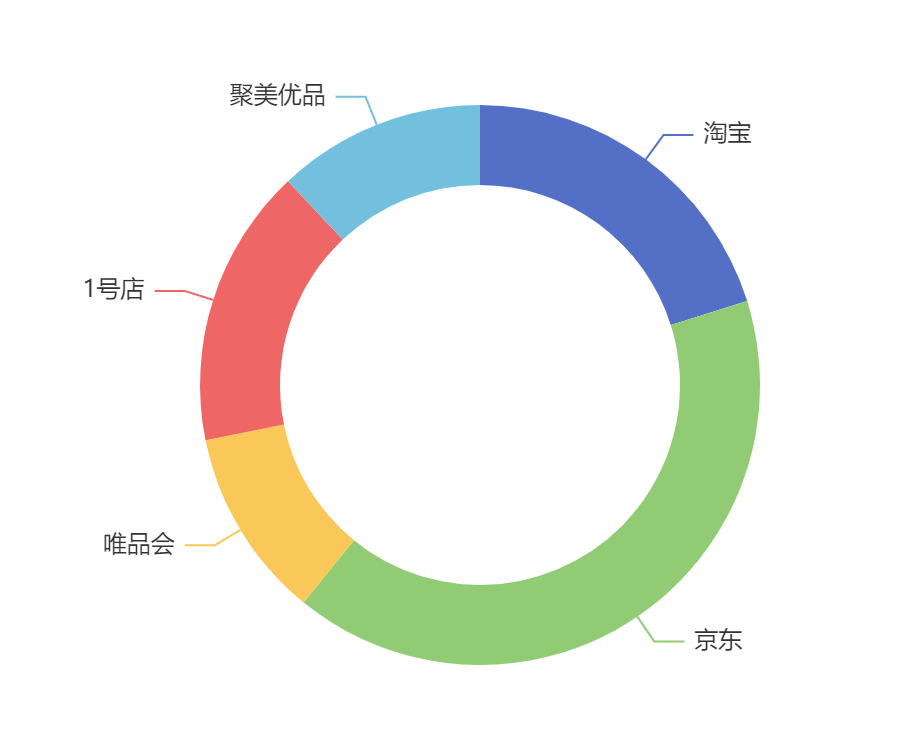
圆环效果
饼图的半径。可以为如下类型:number :直接指定外半径值。 string :例如, ‘20%’ ,表示外半径为可视区尺寸(容器高宽中 较小一项)的 20% 长度。 Array. :数组的第一项是内半径,第二项是外半径, 通过 Array , 可以 将饼图设置为圆环图
<!DOCTYPE html><html lang="en"><head><meta charset="UTF-8"><meta http-equiv="X-UA-Compatible" content="IE=edge"><meta name="viewport" content="width=device-width, initial-scale=1.0"><title>Document</title><script src="../js/echarts.js"></script></head><body><div style="width: 600px;height:400px"></div><script> var mCharts = echarts.init(document.querySelector("div"))// 准备数据var pieData = [{ value: 11231, name: "淘宝", }, { value: 22673, name: "京东" }, { value: 6123, name: "唯品会" }, { value: 8989, name: "1号店" }, { value: 6700, name: "聚美优品" }]// 准备配置项 在 series 下设置 type:pievar option = { series: [ { type: 'pie', data: pieData,//设置圆环radius: ['50%', '70%'],selectedMode: 'multiple',//选中后的偏移量selectedOffset: 30 } ] }mCharts.setOption(option)</script></body></html>

若有收获,就点个赞吧
0 人点赞
