- 在监控体系里面,通常我们认为监控分为:白盒监控和黑盒监控。
- 0 介绍
- 1 下载
- 2 安装
- 3 blackbox.yml文件
- 如下通过method定义了探测时使用的请求方法,对于一些需要请求参数的服务,还可以通过headers定义相关的请求头信息,使用body定义请求内容:
- 而如果用户对于HTTP服务是否启用SSL有强制的标准。则可以使用fail_if_ssl和fail_if_not_ssl进行配置。fail_if_ssl为true时,表示如果站点启用了SSL则探针失败,反之成功。fail_if_not_ssl刚好相反。
- 5 启动
- 6 端口9115
- 7 Blackbox_exporter 应用场景
- 被监控的项写入到文件中
- file_sd_configs:
- - refresh_interval: 1m
- files:
- - “/home/prometheus/conf/blackbox*.yml”
- 相关配置文件,配置相关URL
- cat /home/prometheus/conf/blackbox-dis.yml
- - targets:
- https://www.zhibo8.cc">- https://www.zhibo8.cc
- https://www.baidu.com">- https://www.baidu.com
- 被监控的项写入到文件中
- file_sd_configs:
- - refresh_interval: 10s
- files:
- - “/home/prometheus/conf/ping_status*.yml” #具体的配置文件
- cat ping_status.yml 相关配置文件
- - targets: [‘220.181.38.150’,’14.215.177.39’,’180.101.49.12’,’14.215.177.39’,’180.101.49.11’,’14.215.177.38’,’14.215.177.38’]
- labels:
- group: ‘一线城市-电信网络监控’
- - targets: [‘112.80.248.75’,’163.177.151.109’,’61.135.169.125’,’163.177.151.110’,’180.101.49.11’,’61.135.169.121’,’180.101.49.11’]
- labels:
- group: ‘一线城市-联通网络监控’
- - targets: [‘183.232.231.172’,’36.152.44.95’,’182.61.200.6’,’36.152.44.96’,’220.181.38.149’]
- labels:
- group: ‘一线城市-移动网络监控’
- 7.4 POST配置
- 7.6 SSL证书过期时间监测配置
在监控体系里面,通常我们认为监控分为:白盒监控和黑盒监控。
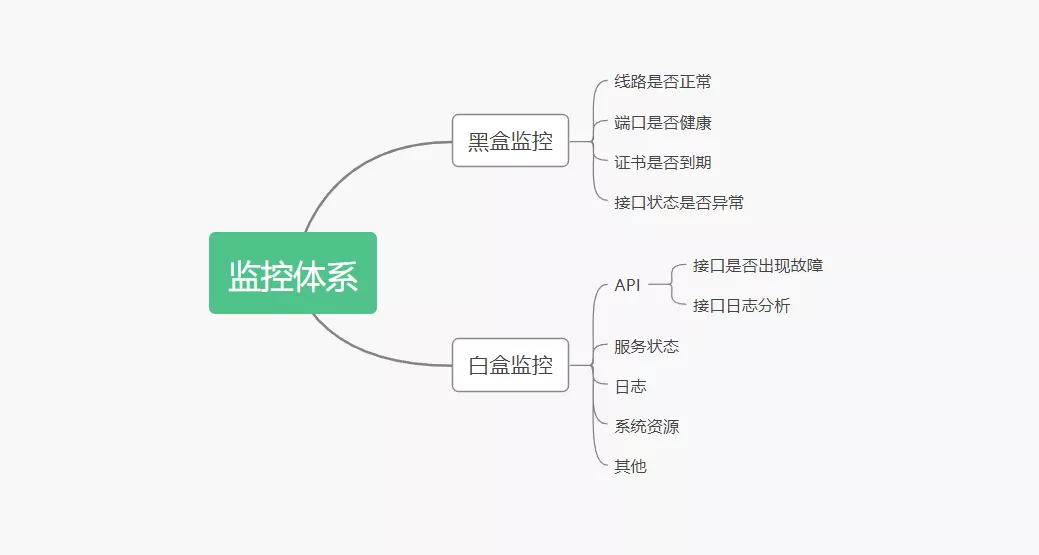
黑盒监控:主要关注的现象,一般都是正在发生的东西,例如出现一个告警,业务接口不正常,那么这种监控就是站在用户的角度能看到的监控,重点在于能对正在发生的故障进行告警。
白盒监控:主要关注的是原因,也就是系统内部暴露的一些指标,例如redis的info中显示redis slave down,这个就是redis info显示的一个内部的指标,重点在于原因,可能是在黑盒监控中看到redis down,而查看内部信息的时候,显示redis port is refused connection。
白盒监控:有很多种,有中间件,有存储,有web服务器例如redis可以使用info暴露内部的指标信息;例如mysql可以使用show variables暴露内部指标信息;例如nginx可以使用nginx_status来暴露内部信息,系统业务指标可以通过埋点或者命令进行采集。
0 介绍
Blackbox_exporter 主动监测主机与服务状态
Prometheus 官方提供的 exporter 之一,可以提供 http、dns、tcp、icmp 的监控数据采集
1 下载
2 安装
tar zxf blackbox_exporter-0.18.0.linux-amd64.tar.gz
cd blackbox_exporter-0.18.0.linux-amd64
3 blackbox.yml文件
- 通过 blackbox.yml 定义模块详细信息
- 在 Prometheus 配置文件中引用该模块以及配置被监控目标主机
```yaml
modules:
http_2xx:
prober: http
http:
preferred_ip_protocol: "ip4" ##如果http监测是使用ipv4 就要写上,目前国内使用ipv6很少。
如下通过method定义了探测时使用的请求方法,对于一些需要请求参数的服务,还可以通过headers定义相关的请求头信息,使用body定义请求内容:
http_post_2xx: ##用于post请求使用的模块)由于每个接口传参不同 可以定义多个module 用于不同接口(例如此命名为http_post_2xx_query 用于监测query.action接口 prober: http http: method: POST headers: Content-Type: application/json ##header头 body: ‘{“hmac”:””,”params”:{“publicFundsKeyWords”:”xxx”}}’ ##传参 tcp_connect: prober: tcp pop3s_banner: prober: tcp tcp: query_response:
- expect: "^+OK"tls: truetls_config:insecure_skip_verify: false
ssh_banner: prober: tcp tcp: query_response:
- expect: "^SSH-2.0-"
irc_banner: prober: tcp tcp: query_response:
- send: "NICK prober"- send: "USER prober prober prober :prober"- expect: "PING :([^ ]+)"send: "PONG ${1}"- expect: "^:[^ ]+ 001"
icmp: prober: icmp
http_2xx_example: prober: http timeout: 5s http: valid_http_versions: [“HTTP/1.1”, “HTTP/2.0”] #如果用户需要指定HTTP返回状态码,或者对HTTP版本有特殊要求,如下所示,可以使用valid_http_versions和valid_status_codes进行定义 valid_status_codes: [] # Defaults to 2xx method: GET headers: Host: vhost.example.com Accept-Language: en-US Origin: example.com fail_if_body_matches_regexp: ## 如果我get的url地址返回的正文中有”Could not connect to database”,那么就会失败,则probe_success值为0
- "Could not connect to database"fail_if_body_not_matches_regexp: ## 如果我get的url地址返回的正文中没有"Download the latest version here",那么就会失败,则probe_success值为0- "Download the latest version here"fail_if_header_matches: # Verifies that no cookies are set- header: Set-Cookieallow_missing: trueregexp: '.*'fail_if_header_not_matches:- header: Access-Control-Allow-Originregexp: '(\*|example\.com)'tls_config:insecure_skip_verify: falsepreferred_ip_protocol: "ip4" # defaults to "ip6"ip_protocol_fallback: false # no fallback to "ip6"
而如果用户对于HTTP服务是否启用SSL有强制的标准。则可以使用fail_if_ssl和fail_if_not_ssl进行配置。fail_if_ssl为true时,表示如果站点启用了SSL则探针失败,反之成功。fail_if_not_ssl刚好相反。
http_2xx_example: prober: http timeout: 5s http: valid_status_codes: [] method: GET no_follow_redirects: false fail_if_ssl: false fail_if_not_ssl: false
http_post_2xx: prober: http timeout: 5s http: method: POST headers: Content-Type: application/json body: ‘{}’
如果HTTP服务启用了安全认证,Blockbox Exporter内置了对basic_auth的支持,可以直接设置相关的认证信息即可:
http_basic_auth_example: prober: http timeout: 5s http: method: POST headers: Host: “login.example.com” basic_auth: username: “username” password: “mysecret”
对于使用了Bear Token的服务也可以通过bearer_token配置项直接指定令牌字符串,或者通过bearer_token_file指定令牌文件。对于一些启用了HTTPS的服务,但是需要自定义证书的服务,可以通过tls_config指定相关的证书信息.
http_custom_ca_example: prober: http http: method: GET tls_config: ca_file: “/certs/my_cert.crt” tls_connect: prober: tcp timeout: 5s tcp: tls: true tcp_connect_example: prober: tcp timeout: 5s imap_starttls: prober: tcp timeout: 5s tcp: query_response:
- expect: "OK.*STARTTLS"- send: ". STARTTLS"- expect: "OK"- starttls: true- send: ". capability"- expect: "CAPABILITY IMAP4rev1"
smtp_starttls: prober: tcp timeout: 5s tcp: query_response:
- expect: "^220 ([^ ]+) ESMTP (.+)$"- send: "EHLO prober\r"- expect: "^250-STARTTLS"- send: "STARTTLS\r"- expect: "^220"- starttls: true- send: "EHLO prober\r"- expect: "^250-AUTH"- send: "QUIT\r"
irc_banner_example: prober: tcp timeout: 5s tcp: query_response:
- send: "NICK prober"- send: "USER prober prober prober :prober"- expect: "PING :([^ ]+)"send: "PONG ${1}"- expect: "^:[^ ]+ 001"
icmp_example: prober: icmp timeout: 5s icmp: preferred_ip_protocol: “ip4” source_ip_address: “127.0.0.1” dns_udp_example: prober: dns timeout: 5s dns: query_name: “www.prometheus.io” query_type: “A” valid_rcodes:
- NOERRORvalidate_answer_rrs:fail_if_matches_regexp:- ".*127.0.0.1"fail_if_all_match_regexp:- ".*127.0.0.1"fail_if_not_matches_regexp:- "www.prometheus.io.\t300\tIN\tA\t127.0.0.1"fail_if_none_matches_regexp:- "127.0.0.1"validate_authority_rrs:fail_if_matches_regexp:- ".*127.0.0.1"validate_additional_rrs:fail_if_matches_regexp:- ".*127.0.0.1"
dns_soa: prober: dns dns: query_name: “prometheus.io” query_type: “SOA” dns_tcp_example: prober: dns dns: transport_protocol: “tcp” # defaults to “udp” preferred_ip_protocol: “ip4” # defaults to “ip6” query_name: “www.prometheus.io”
<a name="oE6lG"></a># 4 写进systemd服务中```bashvim /usr/lib/systemd/system/blackbox_exporter.service[Unit]Description=blackbox_exporterAfter=network.target[Service]Type=simpleExecStart=/data01/prometheus-download/blackbox_exporter-0.18.0.linux-amd64/blackbox_exporter --config.file=/data01/prometheus-download/blackbox_exporter-0.18.0.linux-amd64/blackbox.ymlExecReload=/bin/kill -HUP $MAINPIDExecStop=/bin/kill -KILL $MAINPIDKillMode=control-groupRestart=on-failureRestartSec=3s[Install]WantedBy=multi-user.target
5 启动
systemctl enable blackbox_exportersystemctl start blackbox_exportersystemctl stop blackbox_exportersystemctl reload blackbox_exporter
6 端口9115

7 Blackbox_exporter 应用场景
- HTTP 测试
定义 Request Header 信息
判断 Http status / Http Respones Header / Http Body 内容 - TCP 测试
业务组件端口状态监听
应用层协议定义与监听 - ICMP 测试
主机探活机制 - POST 测试
接口联通性 - SSL 证书过期时间
- grafana 9965模板
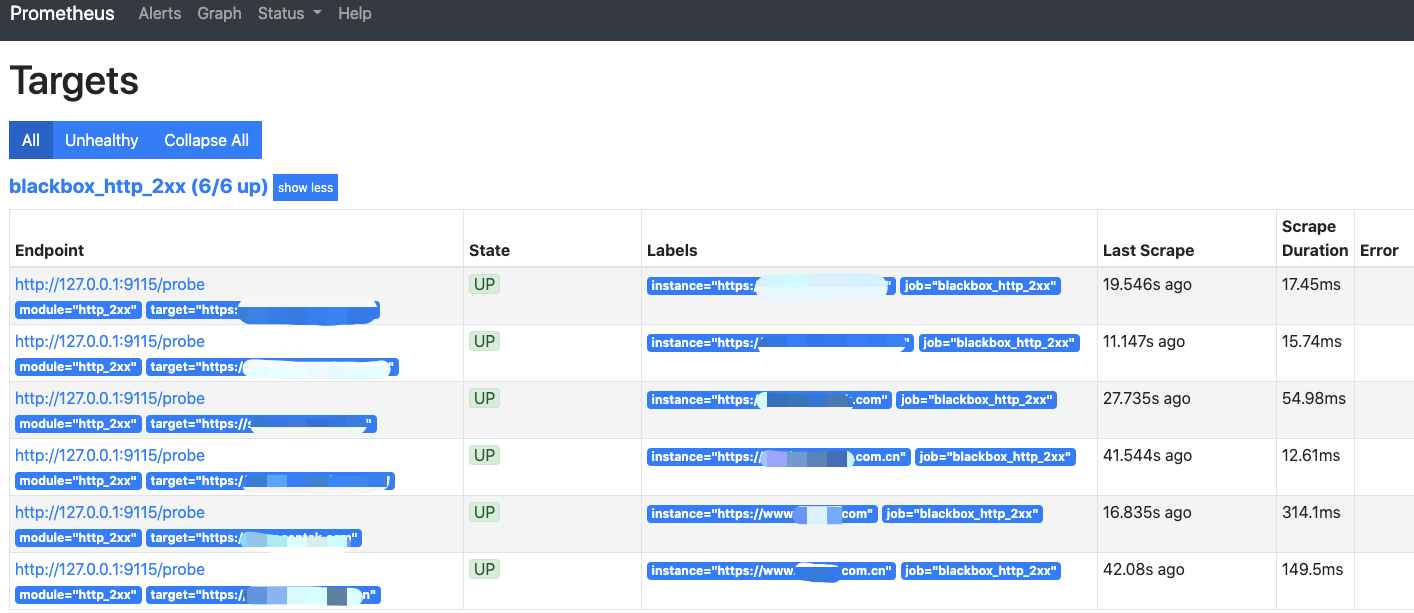
7.1 HTTP配置
- 相关代码块添加到 Prometheus的prometheus.yml文件内
- 对应 blackbox.yml文件的 http_2xx 模块 ```yaml
job_name: ‘blackbox_http_2xx’ scrape_interval: 45s metrics_path: /probe params:
module: [http_2xx] # Look for a HTTP 200 response.
被监控的项写入到文件中
file_sd_configs:
- refresh_interval: 1m
files:
- “/home/prometheus/conf/blackbox*.yml”
相关配置文件,配置相关URL
cat /home/prometheus/conf/blackbox-dis.yml
- targets:
- https://www.zhibo8.cc
- https://www.baidu.com
static_configs:
- targets:- https://www.baidu.com- https://www.taobao.com
relabel_configs:
- source_labels: [__address__]target_label: __param_target- source_labels: [__param_target]target_label: instance- target_label: __address__replacement: 127.0.0.1:9115 # The blackbox exporter's real hostname:port.
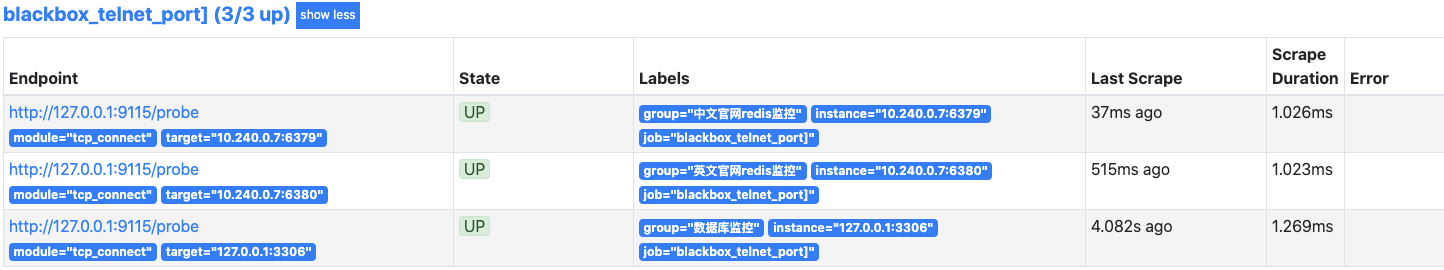
7.2 TCP配置
监听 业务端口地址,用来判断服务是否在线,我觉的和telnet差不多
- 相关代码块添加到 Prometheus的prometheus.yml文件内
- 对应 blackbox.yml文件的 tcp_connect 模块 ```yaml
job_name: “blackbox_telnet_port]” scrape_interval: 5s metrics_path: /probe params:
module: [tcp_connect]
static_configs:
- targets: [ '127.0.0.1:3306' ]labels:group: '数据库监控'- targets: [ '127.0.0.1:6379' ]labels:group: '中文官网redis监控'- targets: [ '127.0.0.1:6380' ]labels:group: '英文官网redis监控'
relabel_configs:
- source_labels: [__address__]target_label: __param_target- source_labels: [__param_target]target_label: instance- target_label: __address__replacement: 127.0.0.1:9115
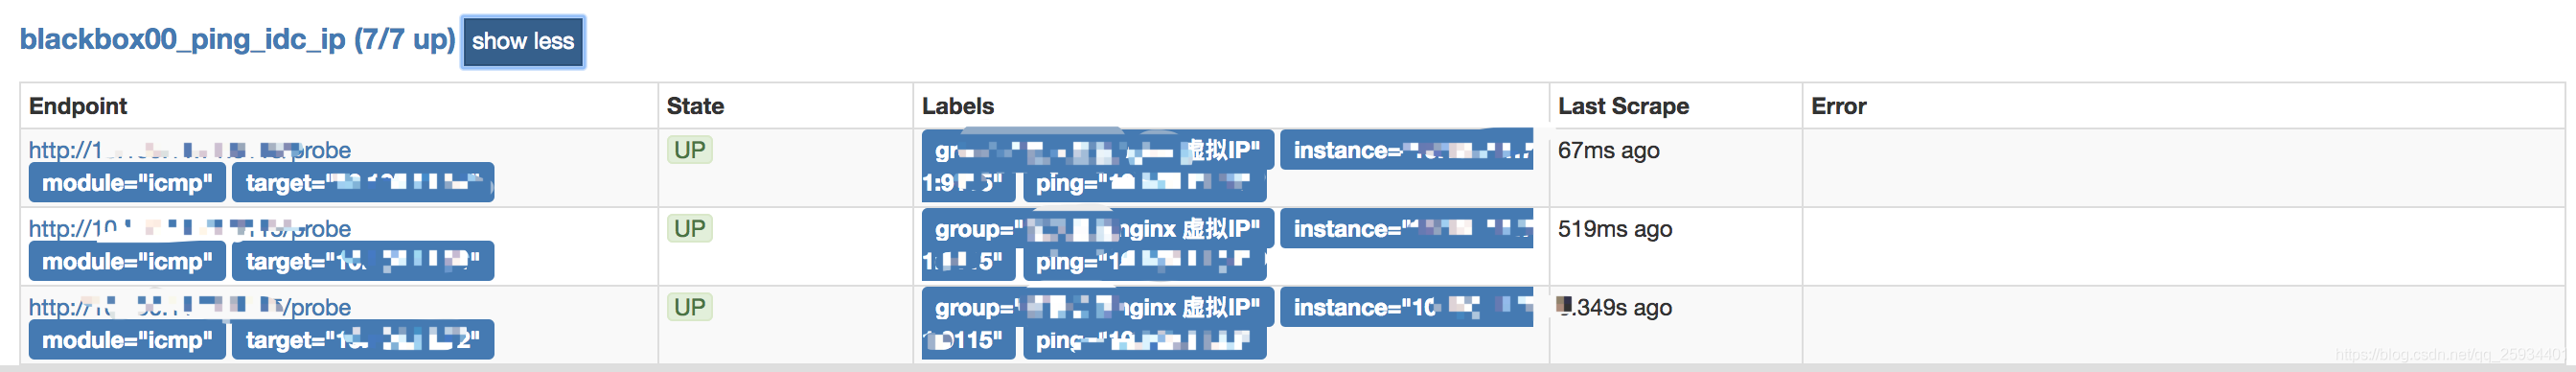
7.3 ICMP配置
相关代码块添加到 Prometheus的prometheus.yml文件内
- 对应 blackbox.yml文件的 icmp 模块 ```yaml
job_name: ‘blackbox_ping_idc_ip’ scrape_interval: 10s metrics_path: /probe params: module: [icmp] #ping,使用icmp模块
被监控的项写入到文件中
file_sd_configs:
- refresh_interval: 10s
files:
- “/home/prometheus/conf/ping_status*.yml” #具体的配置文件
#
cat ping_status.yml 相关配置文件
- targets: [‘220.181.38.150’,’14.215.177.39’,’180.101.49.12’,’14.215.177.39’,’180.101.49.11’,’14.215.177.38’,’14.215.177.38’]
labels:
group: ‘一线城市-电信网络监控’
- targets: [‘112.80.248.75’,’163.177.151.109’,’61.135.169.125’,’163.177.151.110’,’180.101.49.11’,’61.135.169.121’,’180.101.49.11’]
labels:
group: ‘一线城市-联通网络监控’
- targets: [‘183.232.231.172’,’36.152.44.95’,’182.61.200.6’,’36.152.44.96’,’220.181.38.149’]
labels:
group: ‘一线城市-移动网络监控’
#
static_configs:
- targets: [ '1x.xx.xx.xx' ]labels:group: 'xxnginx 虚拟IP'
relabel_configs:
- source_labels: [__address__]regex: (.*)(:80)?target_label: __param_targetreplacement: ${1}- source_labels: [__param_target]target_label: instance- source_labels: [__param_target]regex: (.*)target_label: pingreplacement: ${1}- source_labels: []regex: .*target_label: __address__replacement: 1x.xxx.xx.xx:9115
7.4 POST配置
监听业务接口地址,用来判断接口是否在线
- 相关代码块添加到 Prometheus的prometheus.yml文件内
- 对应 blackbox.yml文件的 http_post_2xx_query 模块(监听query.action这个接口) ```yaml
- job_name: ‘blackbox_http_2xx_post’
scrape_interval: 10s
metrics_path: /probe
params:
module: [http_post_2xx_query]
static_configs:
relabel_configs:- targets:- https://xx.xxx.com/api/xx/xx/fund/query.actionlabels:group: 'Interface monitoring'
- source_labels: [__address__]target_label: __param_target- source_labels: [__param_target]target_label: instance- target_label: __address__replacement: 1x.xx.xx.xx:9115 # The blackbox exporter's real hostname:port.
POST截图<br />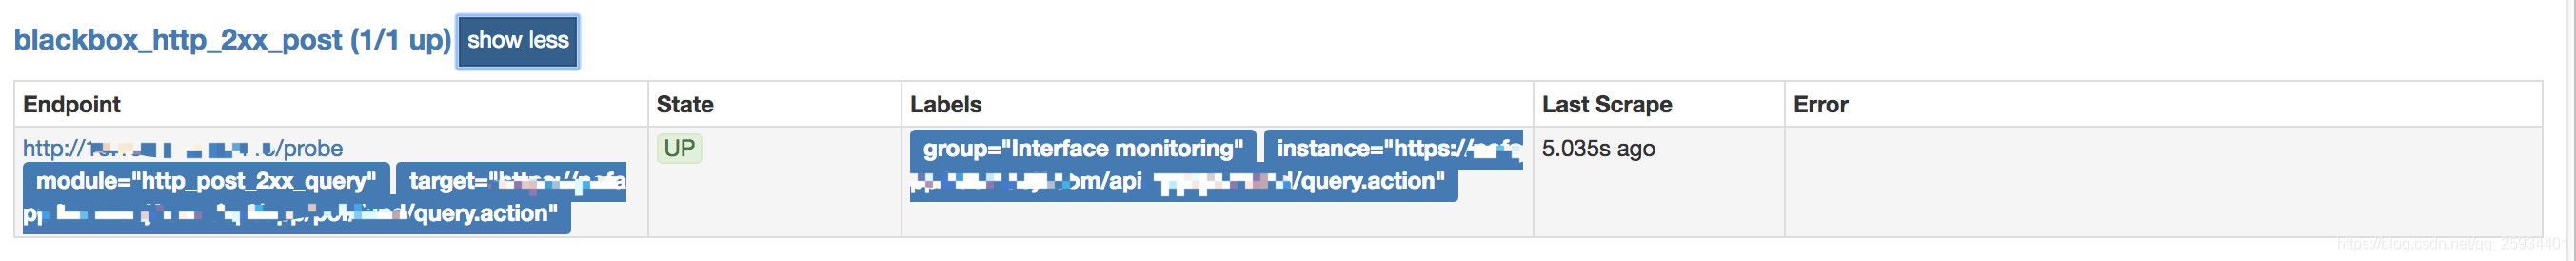post查看监听过程<br />类似于
curl http://172.16.10.65:9115/probe?target=prometheus.io&module=http_2xx&debug=true
<a name="tF7gY"></a>## 7.5 告警配置icmp、tcp、http、post 监测是否正常可以观察probe_success 这一指标<br />probe_success == 0 ##联通性异常<br />probe_success == 1 ##联通性正常<br />告警也是判断这个指标是否等于0,如等于0 则触发异常报警```yaml# 写入到prometheus的rules.yml文件中[root@prometheus01 prometheus]$ cat rules/blackbox-alert.rulesgroups:- name: blackbox_network_statsrules:- alert: blackbox_network_statsexpr: probe_success == 0for: 1mlabels:severity: criticalannotations:summary: "Instance {{ $labels.instance }} is down"description: "This requires immediate action!"
7.6 SSL证书过期时间监测配置
- 相关代码块添加到 Prometheus的prometheus.yml文件内
- 对应 blackbox.yml文件的 http_2xx 模块
告警配置cat << 'EOF' > prometheus.ymlrule_files:- ssl_expiry.rulesscrape_configs:- job_name: 'blackbox'metrics_path: /probeparams:module: [http_2xx] # Look for a HTTP 200 response.static_configs:- targets:- example.com # Target to proberelabel_configs:- source_labels: [__address__]target_label: __param_target- source_labels: [__param_target]target_label: instance- target_label: __address__replacement: 127.0.0.1:9115 # Blackbox exporter.EOF
脚本的监控ssl证书cat << 'EOF' > ssl_expiry.rulesgroups:- name: ssl_expiry.rulesrules:- alert: SSLCertExpiringSoonexpr: (probe_ssl_earliest_cert_expiry{job="blackbox"} - time())/86400 < 30for: 10mlabels:severity: warnannotations:description: '域名{{$labels.instance}}的证书还有{{ printf "%.1f" $value }}天就过期了,请尽快更新证书'summary: "ssl证书过期警告"EOF
openssl命令可以获取证书的过期时间,方法如下:echo |openssl s_client -servername www.baidu.com -connect www.baidu.com:443 2>/dev/null | openssl x509 -noout -dates|awk -F '=' '/notAfter/{print $2}'返回:Jun 25 05:31:02 2020 GMT如果想获取时间戳,方便判断,可以使用date命令转换date +%s -d "$(echo |openssl s_client -servername www.baidu.com -connect www.baidu.com:443 2>/dev/null | openssl x509 -noout -dates|awk -F '=' '/notAfter/{print $2}')"返回:1593063062
参考链接:https://github.com/prometheus/blackbox_exporter/blob/master/example.yml

若有收获,就点个赞吧
0 人点赞
