引言
在过去的项目架构中,如果一个单体出现故障,很容易排查出来的,但是随着项目的架构升级,单体架构暴露出太多的问题,绝大多数公司都采用了微服务的架构。服务的增多,出现的问题就会更多,并且更不容易觉察到。所以拥有一个“前卫”是必要的。可视化页面让你看到接口的请求量、接口的失败率、网络带宽情况、项目所占内存情况等情况。
一、Promethus
1.1 什么是 Promethus ?
Prometheus 是一个开源的监控系统,和告警工具,被多家公司所采纳监控,它由 SoundCloud 开发的 开源监控报警系统 和 时序列数据库 (TSDB)。即按相同时序(相同名称和标签),以时间维度存储连续的数据的集合。
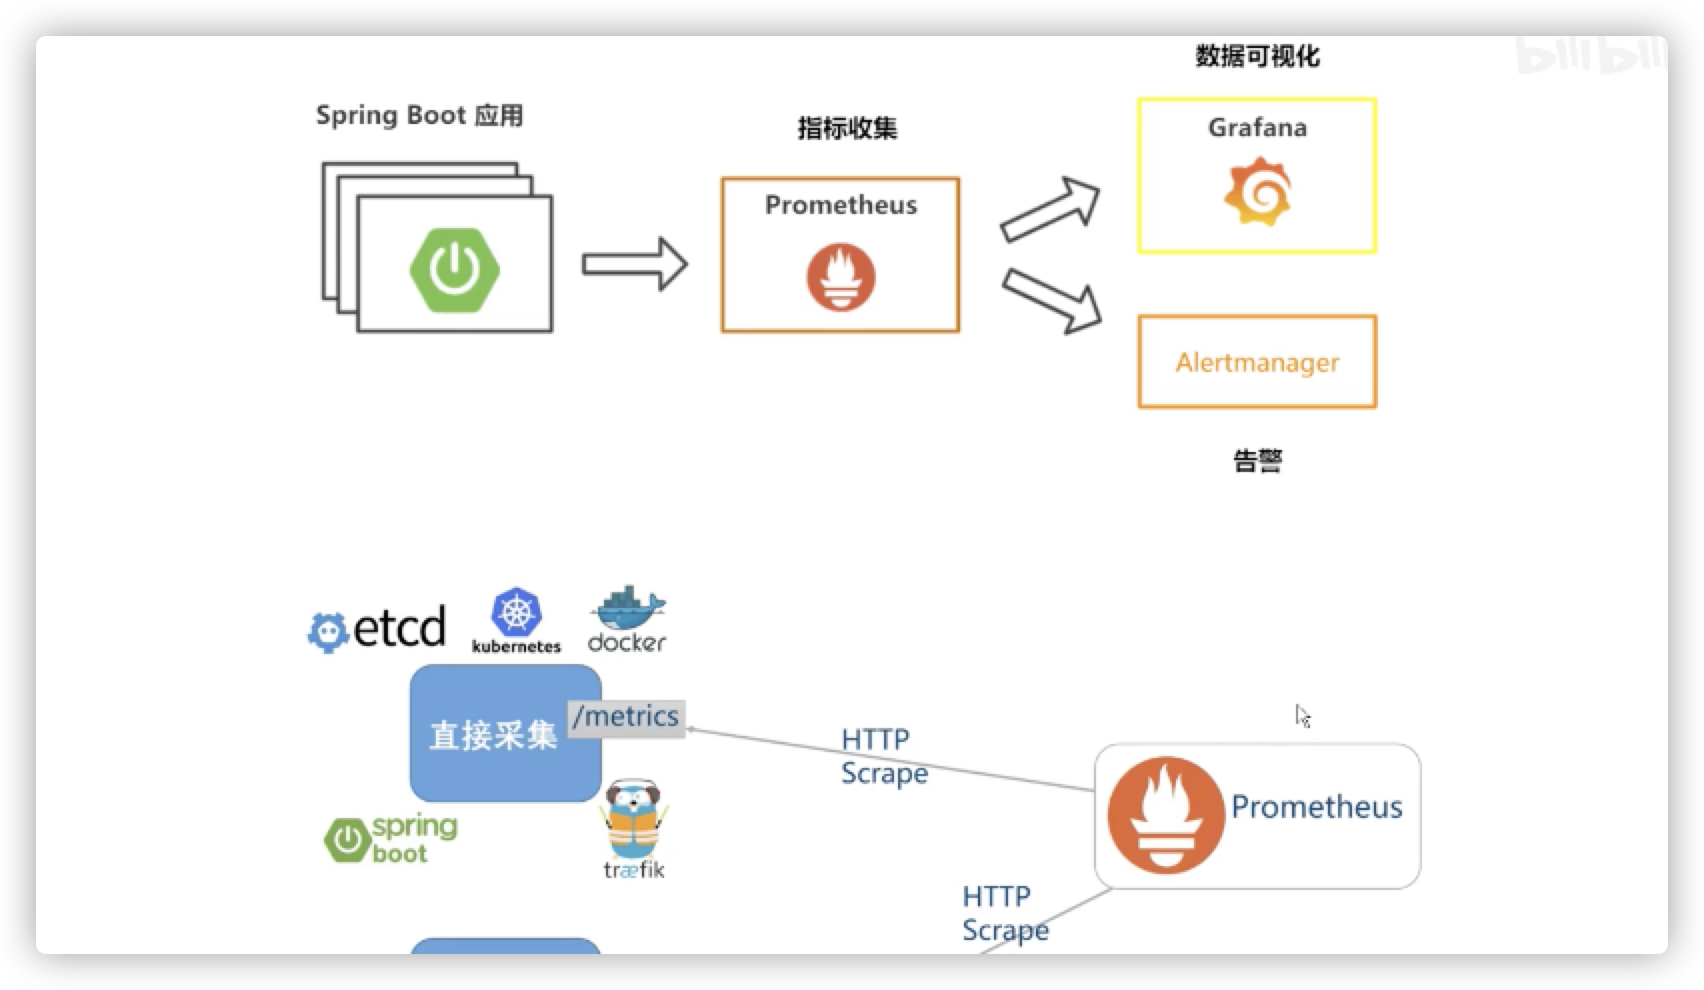
Prometheus 是一款系统和服务监控软件,是 Cloud Native Computing Foundation 目前主流的 2 个开源软件之一,另一个是大名鼎鼎的 kubernetes,俗称 K8s。 Grafana 是一款数据看板工具,可以从多款数据源收集数据并且展示,比如从 Prometheus 拉去数据并展示。 Altermanager 是 Prometheus 官方提供的报警工具,用于接收 Prometheus 推送过来的报警信息,然后转发到微信圈,钉钉群等客户端。
时序( time series )是由名字(Metric)以及一组key/value标签定义的,具有相同的名字以及标签属于相同时序。
- metric名字:表示metric的功能,如
http_request_total。时序的名字由 ASCII 字符,数字,下划线,以及冒号组成,它必须满足正则表达式 [a-zA-Z:][a-zA-Z0-9:]*, 其名字应该具有语义化,一般表示一个可以度量的指标,例如 http_requests_total, 可以表示 http 请求的总数。
<metric name>{<label name>=<label value>, ...}
Prometheus 和 Heapster (Heapster是K8S的一个子项目,用于获取集群的性能数据。)相比功能更完善、更全面。Prometheus 性能也足够支撑上万台规模的集群。
特征:
- 是一个多维数据模型,具有由度量名称/键值对标志的时间序列数据。
- 是一种灵活的查询语言
- 单个服务节点是自制的, 不依赖分布式存储
- 时间序列通过http 的拉取模式
- 推送时间序列通过中间网关支持
- 通过服务发现和配置来来发现目标
- 多种模式的图形和仪表盘支持
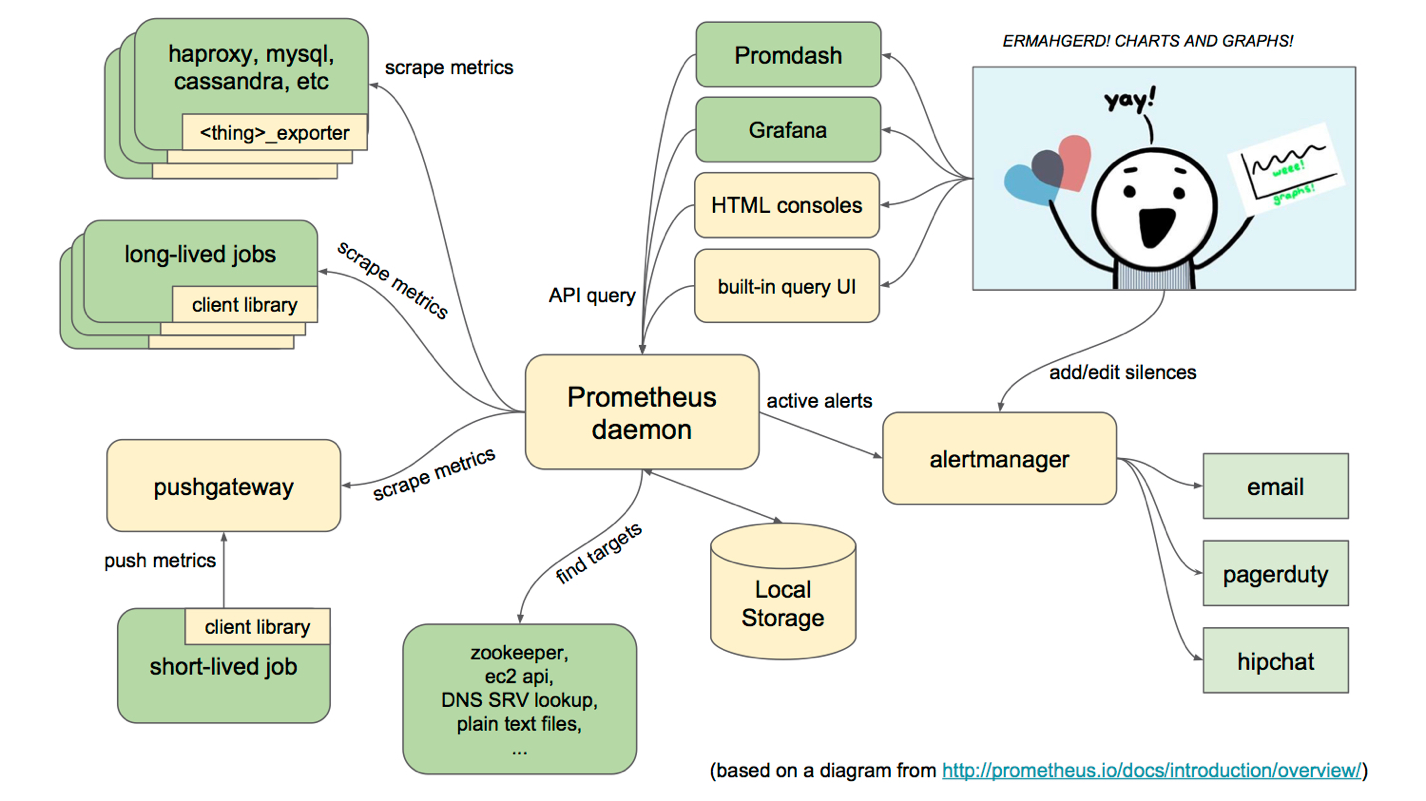
架构:
**
二、SpringBoot Actutor
<dependency><groupId>org.springframework.boot</groupId><artifactId>spring-boot-starter-actuator</artifactId></dependency>
management:endpoints:web:exposure:exclude: '*'endpoint:health:show-details: always# 默认不允许关闭的shutdown:enabled: true
/beans 端点
/bens 端点会返回项目中所有 Spring 容器中的 bean 的别名、类型、是否单例、依赖等信息。 访问
http://localhost:8080/actuator/beans即可。
/heapdump 端点
访问
http://locahost:8080/actuator/heapdump端点时,它会给我们自动生成一个 JVM 堆文件 heapdump。我们可以使用 JDK 自带的 JVM 监控工具VisualVM进行打开此文件并且查看内存快照。
它返回给我们 GZIP 压缩的 JVM 的 heapdump 内存快照。
问题: 开发大型 Java 应用程序的过程中难免遇到内存泄露、OOM、性能瓶颈的问题,比如文件、网络、数据库的连接未释放,未优化的算法等。随着应用程序的持续进行,可能会造成整个系统运行效率下降,严重的则会造成系统崩溃。为了找出程序中隐藏这些原因,在项目开发后期往往会使用性能分析工具对应用的瓶颈进行分析和优化。 简介: VisualVM 是一款免费的性能分析工具,它通过 jvmstat、JMX、SA 以及 Attach API 等多种方式从程序运行时获得实时数据,从而进行动态性能分析。同时,它能自动选择更快更轻量级的技术尽量减少性能分析对应用程序造成的影响,提升性能分析的精度。
- windows 的话在 JDK 安装目录下的 /bin 文件夹下的 jvisualvm.exe
- mac 的话,
/threaddump 端点
该端点方便我们日常定位问题的时候查看线程的情况,主要展示线程名、线程ID、线程状态、是否等待锁资源、线程堆栈信息等。就是可能查看起来不太直观。 访问
http://locahost:8080/actuator/threaddump。
/shutdown 端点
这个端点属于操作控制类的端点,可以优雅的关闭 Spring Boot 应用,要使用这个功能首先需要在配置文件中开启:
management:
    endpoint:
      shutdown:
        enabled: true
由于 shutdown 借口只支持 POST 请求,我们发送 POST 请求 就可以优雅的关闭 SpringBoot 应用。
三、SpringBoot 项目整合 Promethus
1、引入依赖
<dependency>
    <groupId>io.micrometer</groupId>
    <artifactId>micrometer-registry-prometheus</artifactId>
    <version>1.6.0</version>
</dependency>
添加上述依赖项之后,SpringBoot 会自动配置 PrometheusMeterRegister 和 CollectorRegister 来以 Prometheus 可以抓取的格式收集和导出指标数据。
所有的相关数据,都会在 actuator 的 /promrtheus 端点暴露出来。Prometheus 可以抓取该端点以定期获取度量标准数据。
http://localhost:8080/actuator/prometheus
四、Prometheus 的 安装
本文采用 docker 安装,首先要 centos 系统安装 docker 环境,没有的可以百度去安装。
1、pull 安装包
docker pull prom/node-exporter
docker pull prom/prometheus
docker pull grafana/grafana
2、启动 node-expoexporter
docker run -d -p 9100:9100 \
  -v "/proc:/host/proc:ro" \
  -v "/sys:/host/sys:ro" \
  -v "/:/rootfs:ro" \
  --net="host" \
  prom/node-exporter
等待几秒钟,查看端口是否起来了
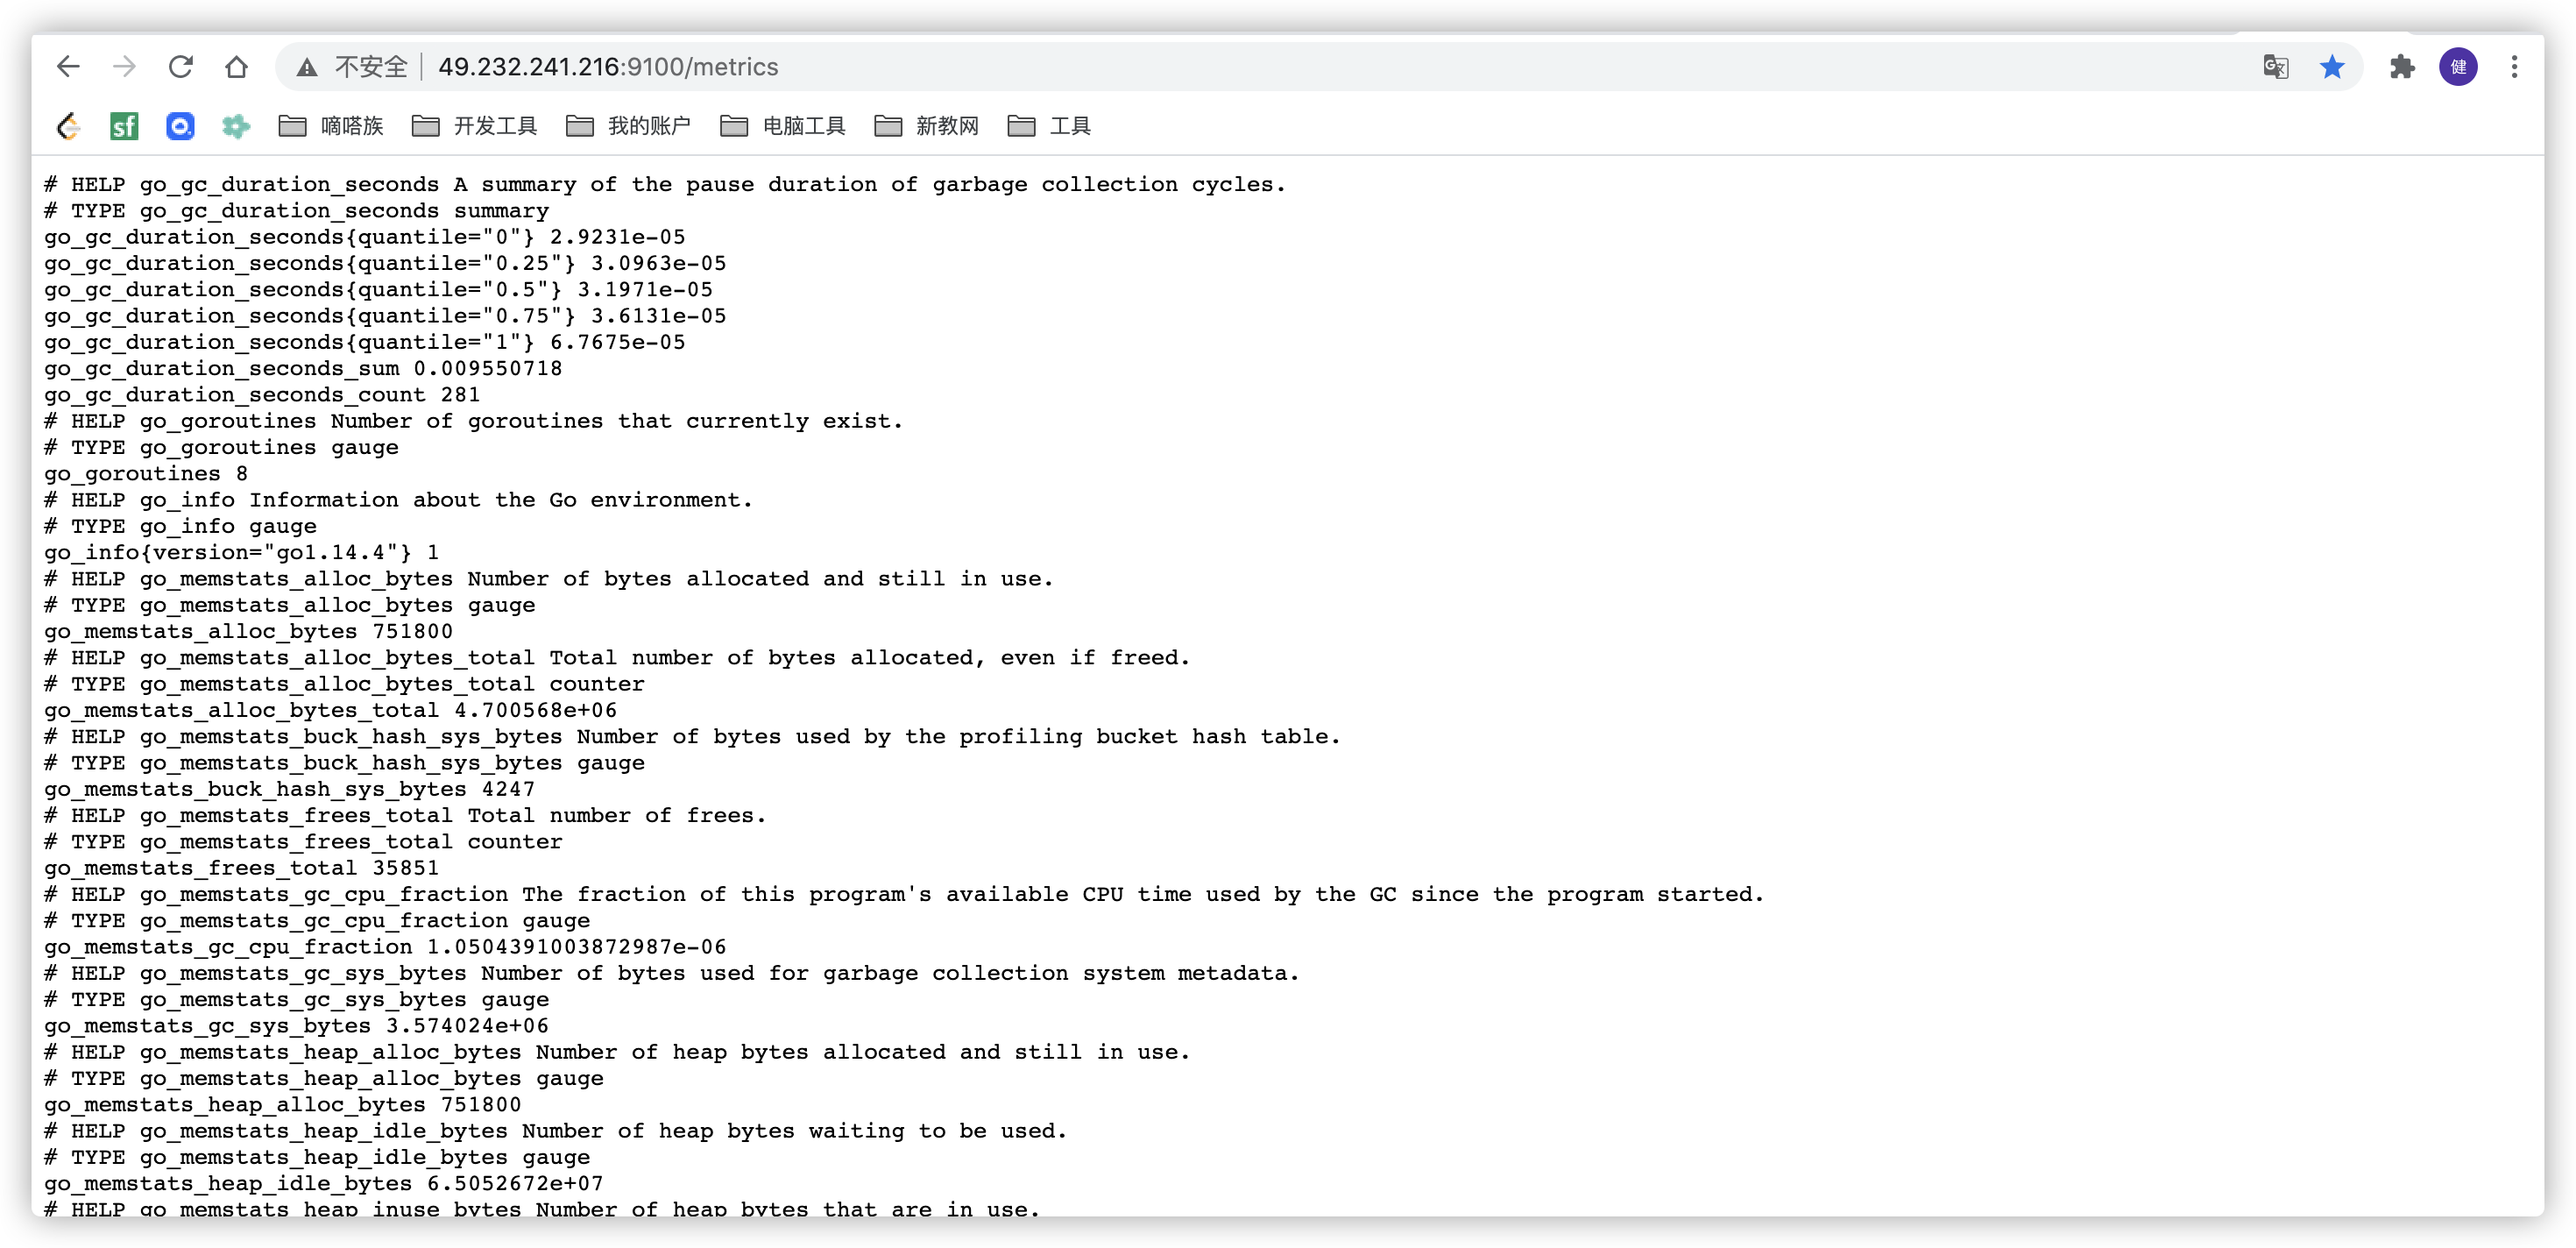
root@ubuntu:~# netstat -anpt
Active Internet connections (servers and established)
Proto Recv-Q Send-Q Local Address           Foreign Address         State       PID/Program name
tcp        0      0 0.0.0.0:22              0.0.0.0:*               LISTEN      1147/sshd
tcp        0     36 192.168.91.132:22       192.168.91.1:63648      ESTABLISHED 2969/0
tcp        0      0 192.168.91.132:22       192.168.91.1:63340      ESTABLISHED 1321/1
tcp6       0      0 :::9100                 :::*                    LISTEN      3070/node_exporter
访问 url
http://192.168.91.132:9100/metrics如下图所示
3、启动 Prometheus
新建目录prometheus,编辑配置文件prometheus.yml
mkdir /opt/prometheus
cd /opt/prometheus/
vim prometheus.yml
内容如下
global:
scrape_interval:     60s
evaluation_interval: 60s
# 这里配置自己服务的 host 和 port
scrape_configs:
- job_name: prometheus
  static_configs:
    - targets: ['localhost:9090']
      labels:
        instance: prometheus

- job_name: linux
  static_configs:
    - targets: ['192.168.91.132:9100']
      labels:
        instance: localhost
docker 启动 Prometheus
docker run  -d \
-p 9090:9090 \
-v /opt/prometheus/prometheus.yml:/etc/prometheus/prometheus.yml  \
prom/prometheus
访问 Prometheus
http://192.168.91.132:9090/graph
4、启动 Grafana新建文件,存储数据
mkdir /opt/grafana-storage
chmod 777 -R /opt/grafana-storage
docker 运行 grafna
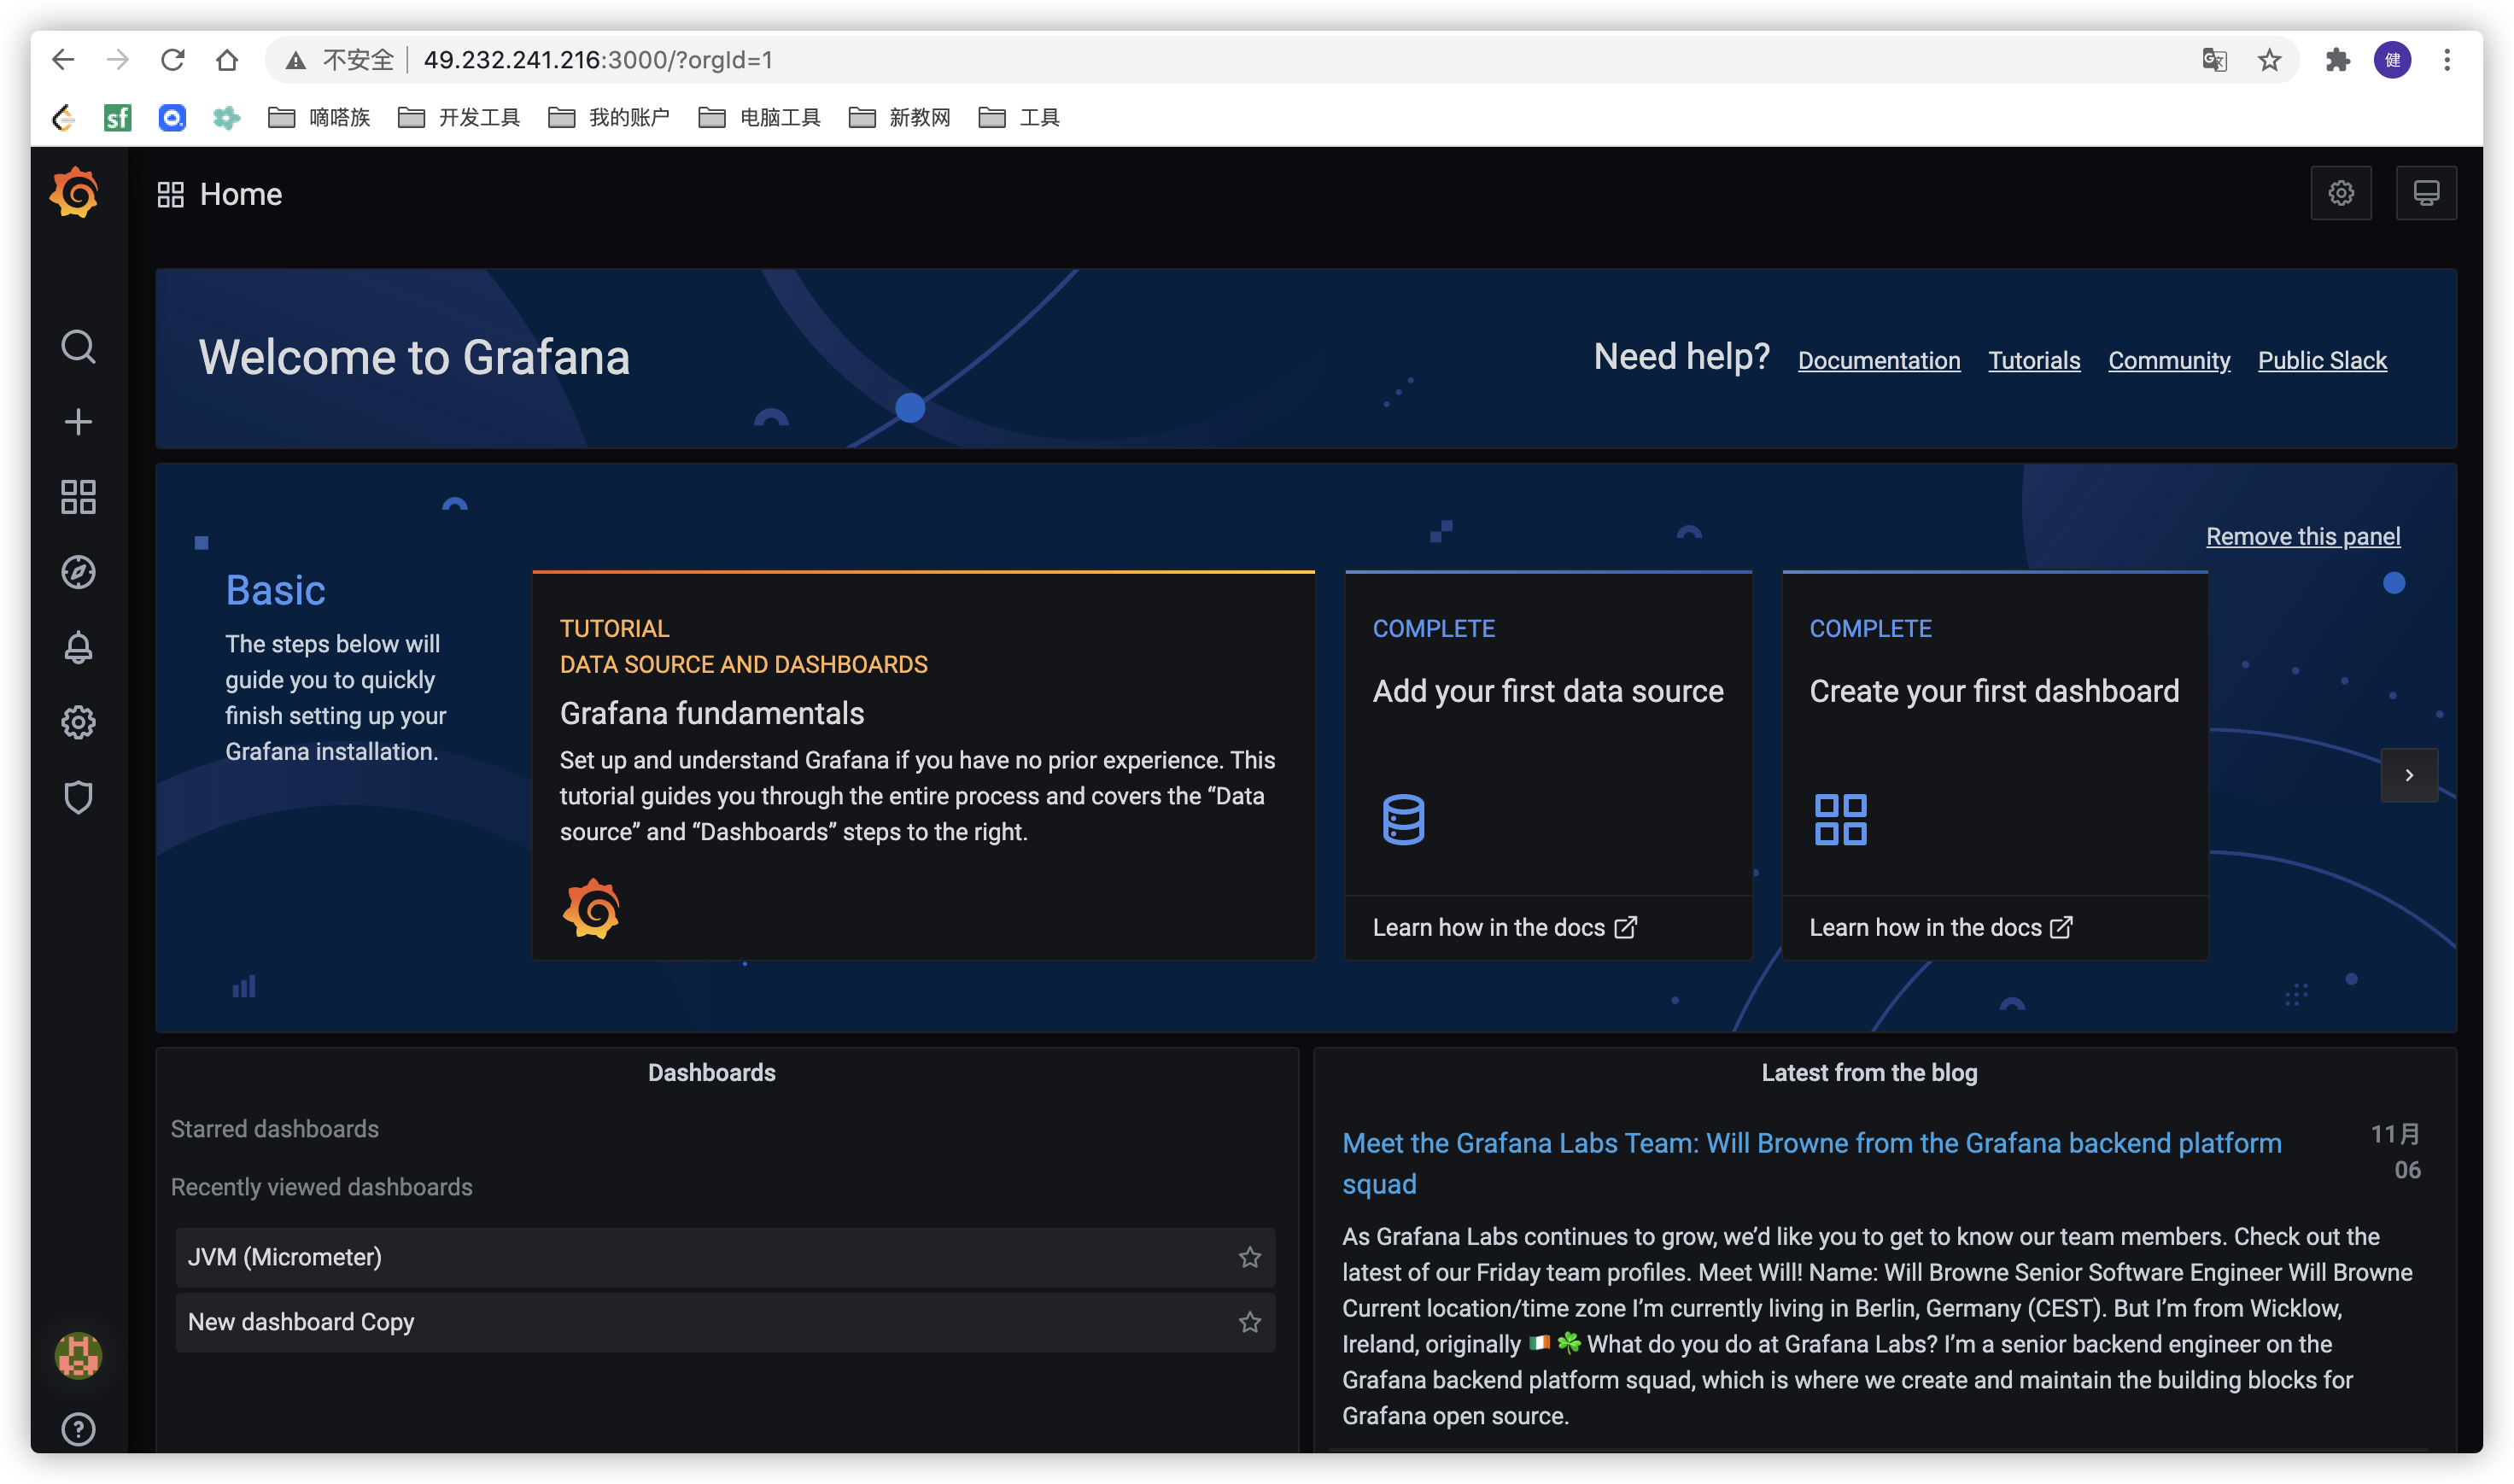
docker run -d \
-p 3000:3000 \
--name=grafana \
-v /opt/grafana-storage:/var/lib/grafana \
grafana/grafana
访问 grafana
http://192.168.91.132:3000/五、Java 项目自定义 Prometheus 埋点
首先声明埋点的类
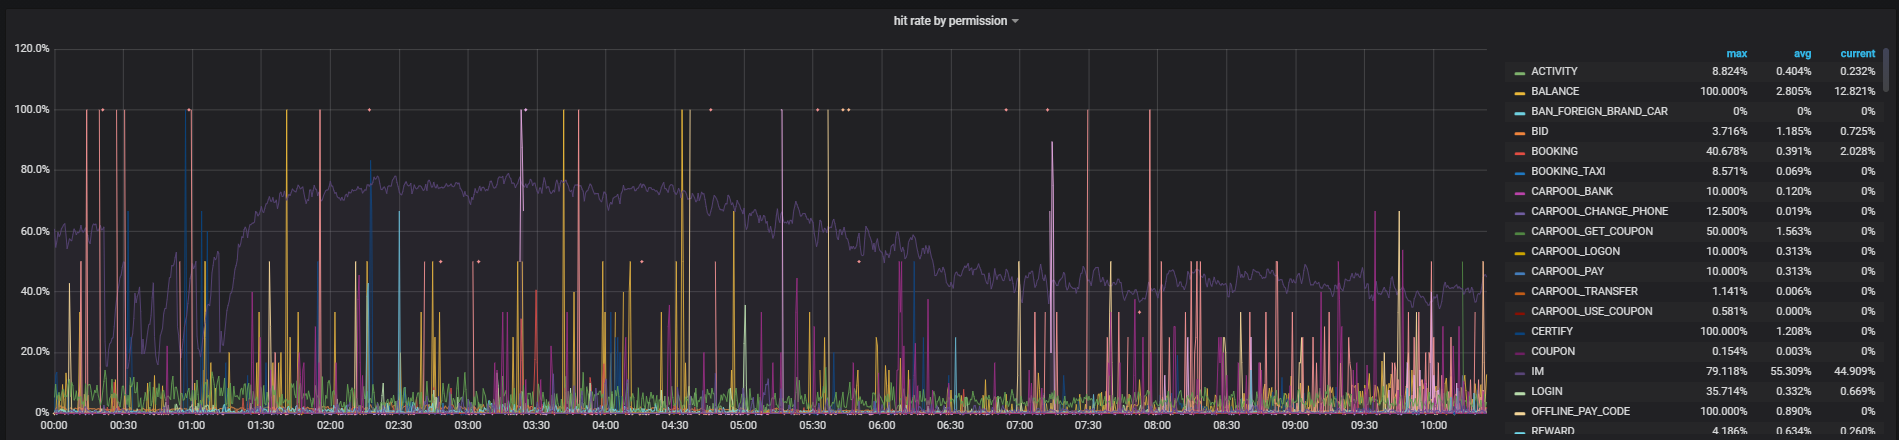
// name : help
public static Counter counter = Counter
          .build("user_permission_request_total", "user permission request")
          .labelNames("action", "permission", "result").register();
数据埋点
BanDetailService.counter.labels("isBanned", permissionEnum.toString(), t.getPermissionResult() == FREE ? "free" : "ban").inc();grafana 监控函数
sum(increase(user_permission_request_total{action="isBanned",result="ban"}[1m])) by (permission)
/
sum(increase(user_permission_request_total{action="isBanned"}[1m])) by (permission)
呈现图像方式如下所示
示例二:访问第三方超时时间的设置
项目中的埋点
private <T> T postForObject(String url, Map<String, String> requestParam, HttpHeaders headers, Class<T> responseType)
          throws RestClientException {
headers = headers == null ? new HttpHeaders() : headers;
headers.setContentType(MediaType.APPLICATION_JSON_UTF8);
String method = url.split("ymt-api")[1].substring(1);
HttpEntity<Object> request = new HttpEntity<>(requestParam, headers);
String resultCode = "0";
Histogram.Timer timer = Const.HEALTH_CODE_REQUEST_HISTOGRAM.labels(ENDPOINT, CHANNEL, method).startTimer();
T result = null;
try {
  result = rest.postForObject(url, request, responseType);
} catch (Exception e) {
  resultCode = e.getClass().getSimpleName();
    log.error("call {} failed, param:{}", method, requestParam, e);
} finally {
  Const.HEALTH_CODE_REQUEST_COUNTER.labels(ENDPOINT, CHANNEL, method, resultCode).inc();
    timer.observeDuration();
}
return result;
}
grafana 埋点
avg(increase(health_code_request_histogram_sum{}[1m])/increase(health_code_request_histogram_count{}[1m])) by(endpoint, channel, method)示例三:第三方接口的访问量
项目信息的埋点 ```java public interface Const {
/**
- 接口请求量的埋点
*/
Counter HEALTH_CODE_REQUEST_COUNTER = Counter.build().name(“health_code_request_counter”)
/* */ Histogram HEALTH_CODE_REQUEST_HISTOGRAM = Histogram.build().name(“health_code_request_histogram”).help("health code request counter.").labelNames("endpoint", "channel", "method", "status").register();.help("health code request histogram.").labelNames("endpoint", "channel", "method").register();
- 接口请求量的埋点
*/
Counter HEALTH_CODE_REQUEST_COUNTER = Counter.build().name(“health_code_request_counter”)
}
```java
private <T> T postForObject(String url, Map<String, String> requestParam, HttpHeaders headers, Class<T> responseType)
            throws RestClientException {
        headers = headers == null ? new HttpHeaders() : headers;
        headers.setContentType(MediaType.APPLICATION_JSON_UTF8);
        String method = url.split("ymt-api")[1].substring(1);
        HttpEntity<Object> request = new HttpEntity<>(requestParam, headers);
        String resultCode = "0";
        Histogram.Timer timer = Const.HEALTH_CODE_REQUEST_HISTOGRAM.labels("机器名", "自定义", "方法名").startTimer();
        T result = null;
        try {
            result = rest.postForObject(url, request, responseType);
        } catch (Exception e) {
            resultCode = e.getClass().getSimpleName();
            log.error("call {} failed, param:{}", method, requestParam, e);
        } finally {
            // 这里做 埋点
            Const.HEALTH_CODE_REQUEST_COUNTER.labels(ENDPOINT, CHANNEL, method, resultCode).inc();
            timer.observeDuration();
        }
        return result;
    }
- grafana 的统计
increase(health_code_request_counter{app="healthcode-thrift-service"}[1m])新增一个 获取当前主机的地址
 public static String getHostName() {
        if(host_name == null) {
            try {
                host_name = InetAddress.getLocalHost().getHostName();
            } catch (UnknownHostException e) {
                logger.error("unknow host", e);
            }
        }
        return host_name;
    }
- MyBatis 的监控 ```java import java.util.Properties;
import com.didapinche.server.commons.common.metrics.InterfaceMonitor; import com.didapinche.server.commons.common.metrics.base.CommonUtils;
import io.prometheus.client.SimpleTimer; import io.prometheus.client.Summary; import org.apache.ibatis.cache.CacheKey; import org.apache.ibatis.executor.Executor; import org.apache.ibatis.mapping.BoundSql; import org.apache.ibatis.mapping.MappedStatement; import org.apache.ibatis.plugin.Interceptor; import org.apache.ibatis.plugin.Intercepts; import org.apache.ibatis.plugin.Invocation; import org.apache.ibatis.plugin.Plugin; import org.apache.ibatis.plugin.Signature; import org.apache.ibatis.session.ResultHandler; import org.apache.ibatis.session.RowBounds; import org.springframework.stereotype.Component;
/**
- mybatis拦截器实现prometheus监控sql层
- @author 刘昌飞(liuchangfei@didachuxing.com)
2018年10月10日 下午1:53:13 */ @Intercepts({ @Signature(type = Executor.class, method = “update”, args = {MappedStatement.class,Object.class}), @Signature(type = Executor.class, method = “query”, args = {MappedStatement.class, Object.class, RowBounds.class, ResultHandler.class }), @Signature(type = Executor.class, method = “query”, args = {MappedStatement.class, Object.class, RowBounds.class, ResultHandler.class, CacheKey.class, BoundSql.class }) }) @Component public class MybatisExecuteInterceptor implements Interceptor {
private static final String MYBATIS = “mybatis”;
private static final Summary sqlLatency = Summary
     .build("server_sql_duration_seconds", "about sql execute duration")
     .labelNames("host", "app", "method")
     .quantile(0.8, 0.01).quantile(0.9, 0.01).quantile(0.99, 0.01)
     .register();
@Override public Object intercept(Invocation invocation) throws Throwable {
 MappedStatement ms = (MappedStatement) invocation.getArgs()[0];
 String id = ms.getId();
 String[] split = id.split("\\.");
 String methodName = split[split.length - 2] + ":" + split[split.length -1];

 InterfaceMonitor.getInstance().addTotal(methodName, MYBATIS);
 SimpleTimer st = new SimpleTimer();

 Object proceed = null;
 try {
     proceed = invocation.proceed();
 } catch (Exception e) {
     InterfaceMonitor.getInstance().addFail(methodName, MYBATIS);
     throw e;
 }
 sqlLatency.labels(CommonUtils.getHostName(), CommonUtils.getAppName(), methodName).observe(st.elapsedSeconds());
 return proceed;
}
@Override public Object plugin(Object target) {
return Plugin.wrap(target, this);}
@Override public void setProperties(Properties properties) { } } ```

若有收获,就点个赞吧
0 人点赞
