原创 ironboxboy Go招聘 前天
收录于话题
#每周一库6
#HTTP1
#压测工具1
我是一只可爱的土拨鼠,专注于分享 Go 职场、招聘和求职,解 Gopher 之忧!欢迎关注我。> 欢迎大家加入Go招聘交流群,来这里找志同道合的小伙伴!跟土拨鼠们一起交流学习。
首先祝Gopher们周末愉快,打扰大家了,今天给大家分享一篇关于HTTP压测工具的短文。
前两天在逛推特,无意中发现一个带有WebUI和终端展示的HTTP压测库plow ,其实老早我就想找一个类似的库,终于被我发现了,哈哈。其实这种数据统计展示也可以在业务API中上报的Metrics相关的grafana监控面板上呈现出来。下面我简单介绍一下这个工具的使用。主要参考了一下readme,00。
plow介绍
plow 是采用 Golang 编写的一个 HTTP(S) 基准测试工具。内部采用了性能出色的fasthttp而不是 Go 的默认net/http。
plow是如何计算的呢,性能怎么样
这里主要受prometheus-普罗米修斯启发是基于流的算法实现实时计算直方图和分位数,具有很低的内存和CPU消耗。因此,基准测试几乎没有额外的性能开销。
安装与使用
可以通过以下三种方式进行安装:
- go get
$ go get -u github.com/six-ddc/plow<br />
- homebrew
$ brew install plow<br />
- Docker 安装
$ docker run --rm --net=host ghcr.io/six-ddc/plow<br /># docker run --rm -p 18888:18888 ghcr.io/six-ddc/plow<br />
使用的话可以执行$ plow --help查看更多帮助信息,支持GET和POST请求。
`$ plow —help
usage: plow [
A high-performance HTTP benchmarking tool with real-time web UI and terminal
displaying
Example:
plow http://127.0.0.1:8080/ -c 20 -n 100000
plow https://httpbin.org/post -c 20 -d 5m —body @file.json -T ‘application/json’ -m POST
Flags:
—help Show context-sensitive help.
-c, —concurrency=1 Number of connections to run concurrently
-n, —requests=-1 Number of requests to run
-d, —duration=DURATION Duration of test, examples: -d 10s -d 3m
-i, —interval=200ms Print snapshot result every interval, use 0 to
print once at the end
—seconds Use seconds as time unit to print
—body=BODY HTTP request body, if start the body with @, the
rest should be a filename to read
—stream Specify whether to stream file specified by
‘—body @file’ using chunked encoding or to read
into memory
-m, —method=”GET” HTTP method
-H, —header=K:V … Custom HTTP headers
—host=HOST Host header
-T, —content=CONTENT Content-Type header
—listen=”0.0.0.0:18888” Listen addr to serve Web UI
—timeout=DURATION Timeout for each http request
—dial-timeout=DURATION Timeout for dial addr
—req-timeout=DURATION Timeout for full request writing
—resp-timeout=DURATION Timeout for full response reading
—socks5=ip:port Socks5 proxy
—version Show application version.
例子
下面主要展示下plow进行get请求压力测试的例子,这里压测图示采用官方的example,命令如下:$ plow [http://127.0.0.1:8080/hello](http://127.0.0.1:8080/hello) -c 20 -d 15s -n 5000000<br />
这里主要测试的是get请求本地接口:建立了20个连接,在15秒内请求了500w次,相信大家也看懂了这里,下面的flag还是解释一下吧。
-c指定连接数(connections)-n指定请求数(number)-d指定请求的时间(duration)
接下来看下下官方的example数据展示,左边是终端数据实时展示,右侧是127.0.0.1:18888的实时WebUI数据展示(延迟:最小延迟-平均延迟-最大延迟,每秒请求数)。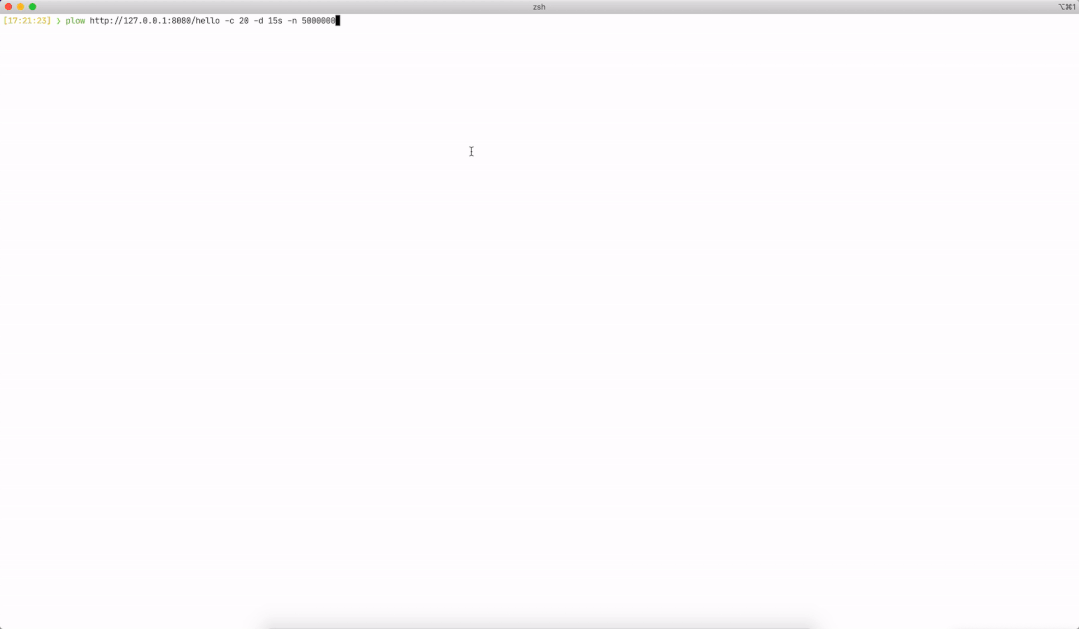
最后大家如有推荐的自己使用和了解的HTTP压测工具,欢迎留言讨论。
参考资料
[1]
plow: https://github.com/six-ddc/plow
[2]
fasthttp: https://github.com/valyala/fasthttp#http-client-comparison-with-nethttp
[3]
prometheus-普罗米修斯: https://github.com/prometheus/client_golang

若有收获,就点个赞吧
0 人点赞
