let myChart = echarts.init(document.getElementById(“echarts-one”));
let option = {
backgroundColor: ‘transparent’,
tooltip: {
trigger: ‘item’,
formatter: function (param) {
return ‘查获物品 ’ + param.value + ‘‘;
},
backgroundColor: ‘rgba(26,52,88,0.8)’,
},
grid: {
top: ‘10%’,
right: ‘3%’,
left: ‘10%’,
bottom: ‘13%’
},
xAxis: {
type: ‘category’,
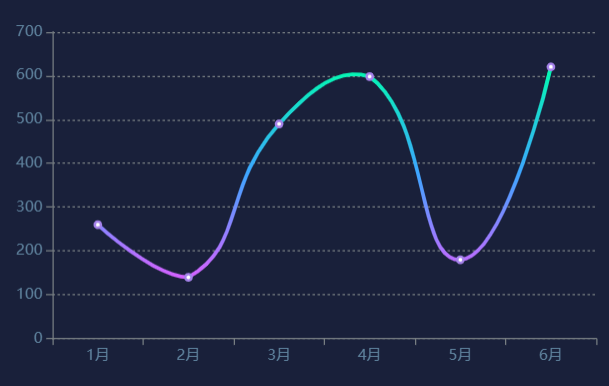
data: [‘1月’, ‘2月’, ‘3月’, ‘4月’, ‘5月’, ‘6月’],
axisLine: {
lineStyle: {
color: ‘#777e82’
}
},
axisLabel: {
color: ‘#5e829d’,
textStyle: {
fontSize: 12
},
},
},
yAxis: {
type: ‘value’,
axisLine: {
lineStyle: {
color: ‘#777e82’
}
},
axisLabel: {
color: ‘#5e829d’,
textStyle: {
fontSize: 12
},
},
splitLine: {
show: true,
lineStyle:{
type:’dotted’, _//设置网格线类型 dotted:虚线 solid:实线,
_color: ‘#777e82’,
}
}
},
series: [ {<br /> name:'液压异常报警',<br /> type: 'line',<br /> smooth:true,<br /> showAllSymbol: true,<br /> symbol: 'circle',<br /> symbolSize: 5,<br /> lineStyle: {<br /> width: 3,<br /> color: new echarts.graphic.LinearGradient(0, 1, 0, 0, [{<br /> offset: 0,<br /> color: '#d860ff'<br /> },{<br /> offset: 0.5,<br /> color: '#3ca6ff'<br /> },{<br /> offset: 1,<br /> color: '#00fdad'<br /> }<br /> ]),<br /> _// shadowColor: 'rgba(158,135,255, 0.3)',<br /> // shadowBlur: 10,<br /> // shadowOffsetY: 20<br /> _},<br /> label: {<br /> show: false,<br /> position: 'top',<br /> textStyle: {<br /> color: '#A582EA',<br /> }<br /> },<br /> itemStyle: {<br /> color: "#fff",<br /> borderColor: "#A582EA",<br /> borderWidth: 2,<br /> },<br /> data:[260, 140, 490, 598,180,620]_//data.values<br /> _}],<br /> color:"#52FFFF",<br />};<br />myChart.setOption(option);<br />$(window).resize(myChart.resize);

若有收获,就点个赞吧
0 人点赞
