let myChart = echarts.init(document.getElementById(“first-chart-item”));
let option = {
backgroundColor: ‘transparent’,
tooltip: {
trigger: ‘item’,
formatter: function (param) {
return ‘预警数量 ’ + param.value + ‘‘;
},
backgroundColor: ‘#103B6E’,
},
_// title: {
// text:’预警事件’,
// x: ‘left’, // 水平安放位置,默认为左对齐,可选为:
// // y: ‘top’, // 垂直安放位置,默认为全图顶端,可选为:
// textStyle: {
// fontSize: 14,
// fontWeight: ‘bolder’,
// color: ‘#52FEFE’ // 主标题文字颜色
// },
// },
_grid: {
top: ‘10%’,
right: ‘3%’,
left: ‘10%’,
bottom: ‘13%’
},
xAxis: {
type: ‘category’,
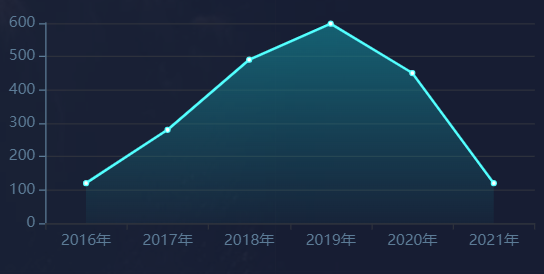
data: [‘2016年’, ‘2017年’, ‘2018年’, ‘2019年’, ‘2020年’, ‘2021年’],
axisLine: {
lineStyle: {
color: ‘#2D313C’
}
},
axisLabel: {
color: ‘#5C7C97’,
textStyle: {
fontSize: 12
},
},
},
yAxis: {
type: ‘value’,
axisLine: {
lineStyle: {
color: ‘#5C7C97’
}
},
splitLine: {
show: true,
lineStyle:{
color: ‘#2D313C’,
}
}
},
series: [{<br /> type: 'line',<br /> data: [120, 280, 490, 598,450,120],<br /> areaStyle: {<br /> normal: {<br /> color: new echarts.graphic.LinearGradient(0, 0, 0, 1, [{<br /> offset: 0,<br /> color: 'rgba(20,125,141,1)'<br /> }, {<br /> offset: 1,<br /> color: 'rgba(20,125,141,0.1)'<br /> }]),<br /> }<br /> }<br /> }],<br /> color:"#52FFFF",<br />};<br />myChart.setOption(option);<br />$(window).resize(myChart.resize);

若有收获,就点个赞吧
0 人点赞
