import pandas as pdimport numpy as npimport matplotlib.pyplot as pltfrom sklearn.tree import DecisionTreeClassifierfrom sklearn.tree import plot_treefrom sklearn.model_selection import train_test_splitfrom sklearn.model_selection import cross_val_scorefrom sklearn.metrics import confusion_matrixfrom sklearn.metrics import plot_confusion_matrix
df=pd.read_csv('https://archive.ics.uci.edu/ml/machine-learning-databases/heart-disease/processed.cleveland.data',header=None)df.head()

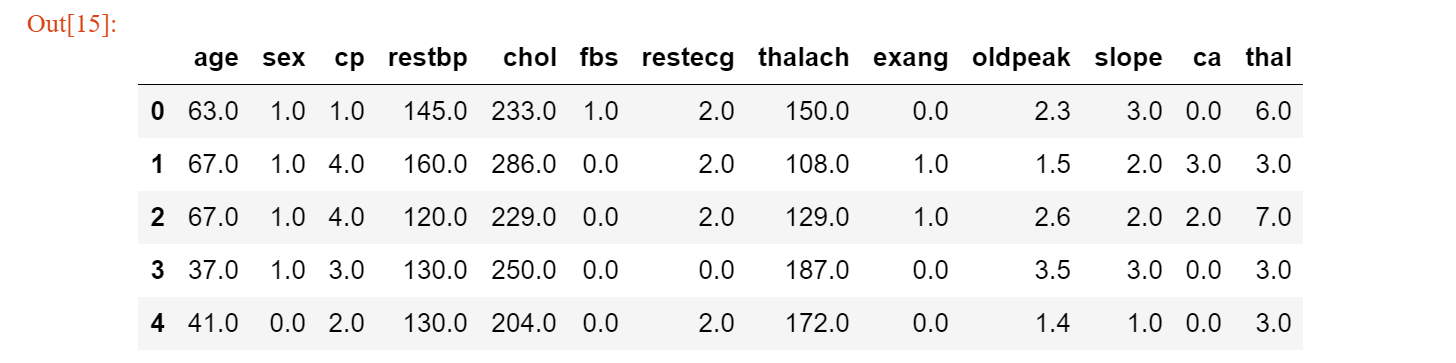
df.columns=['age','sex','cp','restbp','chol','fbs','restecg','thalach','exang','oldpeak','slope','ca','thal','hd']df.head()

df.describe()

df['ca'].unique() #输出所有的种类

len(df.loc[(df['ca']=='?') |(df['thal']=='?')]) #查看这两列有多少列#6len(df) #查看有多少行
df_np_missing=df.loc[(df['ca']!='?') &(df['thal']!='?')] #直接去掉含有这些?的行


df_np_missing['ca'].unique() #查看类别

X=df_np_missing.drop('hd',axis=1).copy()X.head()
onehot 编码
X['cp'].unique()pd.get_dummies(X,columns=['cp']).head() #类似于转换为因子

X_encoded=pd.get_dummies(X,columns=['cp','restecg','slope','thal']);X_encoded.head()

y.unique()y_not_zero_index= y > 0y[y_not_zero_index]=1y.unique()
y_not_zero_index.head()
X_train,x_test,y_train,y_test=train_test_split(X_encoded,y,random_state=42)

若有收获,就点个赞吧
0 人点赞
