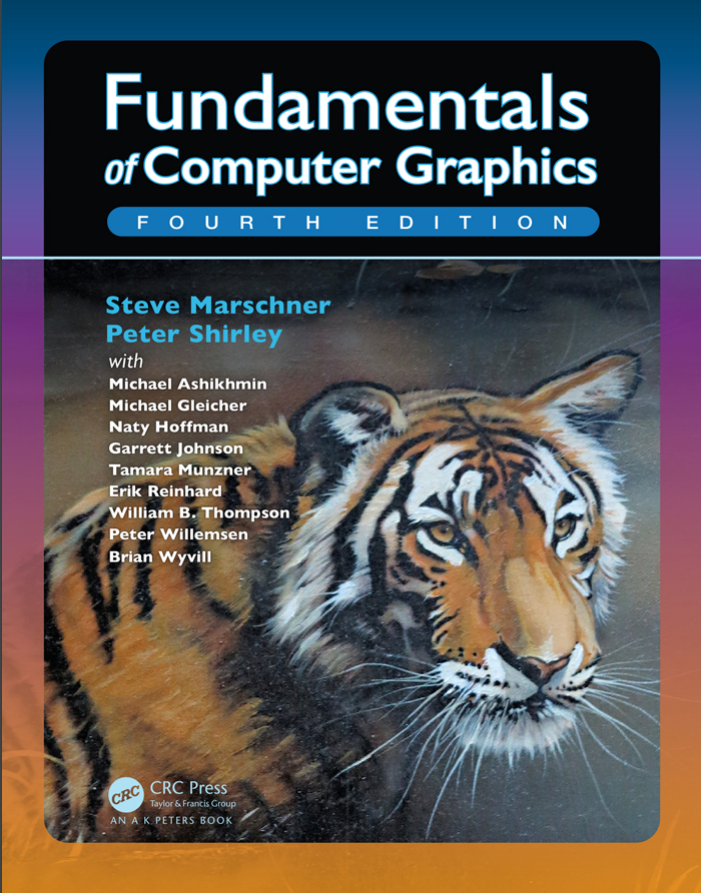
虎书读书笔记
图形学:1950年,美国麻省理工学院(MIT) 诞生了旋风I号(Whirlwind I)计算机及其显示器。该显示器用一个类似于示波器的阴极射线管 (CRT) 来显示一些简单的图形
计算机图形学一般包含几何(Geometry)、渲染(Rendering)、模拟(Simulation),也有人说计算机图形学主要包含建模(Modeling)、渲染(Rendering)、动画(Animation)、人机交互(Human-computer Interaction)
对图形学的认知
Even though modelling and rendering in computer graphics have been improved tremendously in the past 35 years, we are still not at the point where we can model automatically a tiger swimming in the river in all its glorious details. By automatically I mean in a way that does not need careful manual tweaking by an artist/expert.
The bad news is that we have still a long way to go.
The good news is that we have still a long way to go.
尽管在过去的35年里,计算机图形学的建模和渲染技术得到了极大的改进,但我们仍然无法自动模拟一只在河流中游泳的老虎的所有精彩细节。我所说的自动是指不需要艺术家/专家仔细手动调整的方式。
坏消息是,我们还有很长的路要走。
好消息是,我们还有很长的路要走。
图形学涉及的领域
最主要的三个领域 1. Modeling (模型) 2. Rendering (渲染) 3. Animation (动画)
其他领域:1 、 User interaction (用户交互) 2、 Virtual reality (虚拟现实)3、 Visualization (可视化)
4、 Image processing (图像处理) 5、 3D scanning (三维扫描)6、 Computational photography (计算成像)
图形学主要应用
1、 Video games (电子游戏)2、 Cartoons (卡通动画)3、 Visual effects (视觉特效)4、 Animated films (动画电影)5、 CAD/CAM (计算机辅助设计/计算机辅助制造)6、 Simulation (模拟)7、 Medical imaging (医学成像)例如 computed tomography (CT) 8、 Information visualization (信息可视化)
图像处理建议
The speed at which images can be generated depends strongly on the number of triangles being drawn. Because interactivity is more important in many applications than visual quality, it is worthwhile to minimize the number of triangles used to represent a model. In addition, if the model is viewed in the distance, fewer triangles are needed than when the model is viewed from a closer distance. This suggests that it is useful to represent a model with a varying level of detail (LOD).
生成图像的速度很大程度上取决于绘制的三角形数量。因为在许多应用程序中,交互性比视觉质量更重要,所以有必要尽量减少用于表示模型的三角形数量。此外,如果从远处观察模型,需要的三角形比从近距离观察模型时要少。
这表明用不同层次的细节表示模型是有用的
(LOD)。
数值问题 ( Numerical Issues )
three “special” values for real numbers in IEEE floating-point (IEEE浮点数中有三个“特殊”值):
1、 Infinity (∞)(无穷大) 2、 Minus infinity (−∞) (负无穷) 3.、Not a number (NaN) (不是数字)
对于任意正实数a, 和无穷大相关的除法有如下所示
- +a/(+∞) = +0
- −a/(+∞) = −0
- +a/(−∞) = −0
- −a/(−∞) = +0
其他涉及无穷大值的操作与我们预期的一样。
对于正实数a,行为如下:
- ∞ + ∞ = +∞
- ∞−∞ = NaN
- ∞×∞ = ∞
- ∞/∞ = NaN
- ∞/a = ∞
- ∞/0 = ∞
- 0/0 = NaN
布尔表达式中包含无限值的规则如下所示:
- 有效数都小于+∞。
- 有效数都大于−∞。
- −∞小于+∞。
涉及具有NaN值的表达式的规则很简单:
1. 任何包含NaN的算术表达式结果也是NaN。
2. 任何涉及NaN的布尔表达式都是false。
对于任意正实数a,除以0有以下规则:
- +a/ +0 = +∞
- −a/ +0 = −∞
效率( Efficiency )
在可预见的将来,一个好的想法是程序员应该更多地关注内存访问模式,而不是操作计数。这与20年前的最佳启发式正好相反。发生这种转换是因为内存的速度没有跟上处理器的速度。既然这种趋势还在继续,那么有限的、一致的内存访问对于优化是具有重要意义的
一种使代码快速的合理方法是按照以下顺序进行
1. Write the code in the most straightforward way possible. Compute intermediate results as needed on the fly rather than storing them.
2. Compile in optimized mode.
3. Use whatever profiling tools exist to find critical bottlenecks.
4. Examine data structures to look for ways to improve locality. If possible, make data unit sizes match the cache/page size on the target architecture.
5. If profiling reveals bottlenecks in numeric computations, examine the assembly code generated by the compiler for missed efficiencies. Rewrite source code to solve any problems you find.
1.直接编写代码。根据需要动态计算中间结果,而不是存储它们。
2. 以优化模式编译。
3.使用任何现有的分析工具来找到关键的瓶颈。
4. 检查数据结构,寻找改善局部结构的方法。如果可能,让数据单元大小与目标结构上的缓存或者页面大小一致。
5. 如果分析揭示了数值计算中的瓶颈,请检查编译器生成的汇编代码,以确定这段代码是否降低了程序的效率。重写源代码来解决您发现的问题。
tips: 要注意来自以往的建议;一些经典的技巧,如使用整数代替实数,可能不再带来速度,因为现代cpu通常可以像执行整数操作一样快地执行浮点操作。
在所有情况下,都需要对特定机器进行分析,以确保任何优化的优点
图形程序设计
一些基本类的要素
•vector2:存储x和y分量的2D矢量类。它应该将这些组件存储在一个长度为2的数组中,以便能够很好地支持索引操作符。还应该包括向量加法、向量减法、点积、叉积、标量乘法和标量除法的运算。
•vector3 一个类似于vector2的3D向量类。
•hvector 具有四个分量的齐次向量。
•rgb 一种RGB颜色,存储三项。您还应该包括RGB加法、RGB减法、RGB乘法、标量乘法和标量除法的操作。
•transform 一个用于变换的4 × 4矩阵。您应该包括一个矩阵乘法和一些成员函数,以应用于位置、方向和曲面的法向量。
•image: 一个可以输出RGB像素的2D数组。
单精度还是双精度
现代架构表明,保持低内存使用和保持一致的内存访问是效率的关键。建议使用单精度数据。为了避免数值问题,建议采用双精度算法。权衡取决于程序,但是在类定义中有一个默认值是很好的
图形程序调试
1、我们创建一个图像,然后观察它的问题所在。然后,我们提出一个关于问题原因的假设并进行验证。
2、在许多情况下,从图形程序中获取调试信息的最简单渠道是输出图像本身。如果您想知道针对每个像素运行的部分计算的某个变量的值,可以临时修改程序,将该值直接复制到输出图像,并跳过通常会进行的其余计算。例如,如果怀疑曲面法线问题导致着色问题,可以将法线向量直接复制到图像(x变为红色,y变为绿色,z变为蓝色),从而生成计算中实际使用的向量的彩色编码图示。或者,如果您怀疑某个特定值有时超出其有效范围,请让您的程序在发生这种情况的地方写入亮红色像素。其他常见技巧包括使用明显的颜色绘制曲面的背面(当它们不应该可见时),根据对象的ID号为图像着色,或根据计算所需的工作量为像素着色。
(In many cases, the easiest channel by which to get debugging information out of a graphics program is the output image itself. If you want to know the value of some variable for part of a computation that runs for every pixel, you can just modify your program temporarily to copy that value directly to the output image and skip the rest of the calculations that would normally be done. For instance, if you suspect a problem with surface normals is causing a problem with shading, you can copy the normal vectors directly to the image (x goes to red, y goes to green, z goes to blue), resulting in a color-coded illustration of the vectors actually being used in your computation. Or, if you suspect a particular value is sometimes out of its valid range, make your program write bright red pixels where that happens. Other common tricks include drawing the back sides of surfaces with an obvious color (when they are not supposed to be visible), coloring the image by the ID numbers of the objects, or coloring pixels by the amount of work they took to compute.)
3、仍然有一些情况,特别是当科学方法似乎导致了矛盾时,没有什么可以替代观察到底发生了什么。问题是,图形程序常常涉及到对同一代码的多次执行(例如,每像素执行一次,或每三角形执行一次),因此从一开始就在调试器中单步执行完全不切实际。最困难的错误通常只发生在复杂的输入上。
一种有用的方法是为bug“设置陷阱”。首先,确保您的程序 是确定性的,在单个线程中运行它,并确保所有随机数都是从固定种子计算出来的。然后,找出哪个像素或三角形显示了使用固定随机数种子的特殊调试模式。该bug并在您怀疑的代码之前添加一条语句,该语句不正确,将仅针对可疑情况执行。例如,如果您发现该像素(126,247)显示该错误,则添加:
if x = 126 and y = 247 then print “blarg!”
如果在print语句上设置了断点,则可以在计算感兴趣的像素之前立即进入调试器
数据可视化调试
Often it is hard to understand what your program is doing, because it computes a lot of intermediate results before it finally goes wrong. The situation is similar to a scientific experiment that measures a lot of data, and one solution is the same: make good plots and illustrations for yourself to understand what the data means. For instance, in a ray tracer you might write code to visualize ray trees so you can see what paths contributed to a pixel, or in an image resampling routine you might make plots that show all the points where samples are being taken from the input. Time spent writing code to visualize your program’s internal state is also repaid in a better understanding of its behavior when it comes time to optimize it.
通常很难理解您的程序在做什么,因为它在最终出错之前会计算很多中间结果。这种情况类似于测量大量数据的科学实验,但有一种解决方案是相同的:为自己绘制好图和插图,以了解数据的含义。例如,在光线跟踪器中,您可以编写代码来可视化光线树,以便查看哪些路径有助于像素,或者在图像重采样例程中,您可以绘制显示从输入中采样的所有点的图。在优化程序时,花时间写代码去分析程序内部状态上的状态也会有助于更好地理解其行为。

