效果图: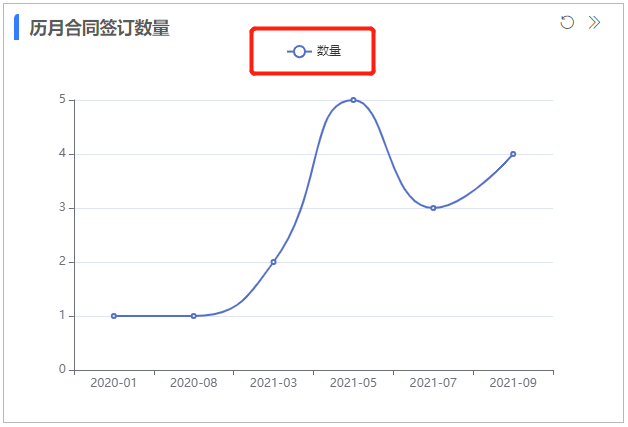
代码:(实现方法:在series给name值,这样图例就可以显示出来了)
//历月合同签订数量private contractChart() {let contractChart = echarts.init(document.getElementById('contractChart') as HTMLElement)contractChart.setOption({xAxis: {type: 'category',data: ['2020-01','2020-08','2021-03','2021-05','2021-07','2021-09',],},yAxis: {type: 'value',splitLine: { //网格线show: true,},axisLine: { //轴线show: true,},axisTick: { //轴刻线show: true,},},legend: {show: true,},series: [{name: '数量',data: [1, 1, 2, 5, 3, 4],type: 'line',smooth: true,},],})}

若有收获,就点个赞吧
0 人点赞


