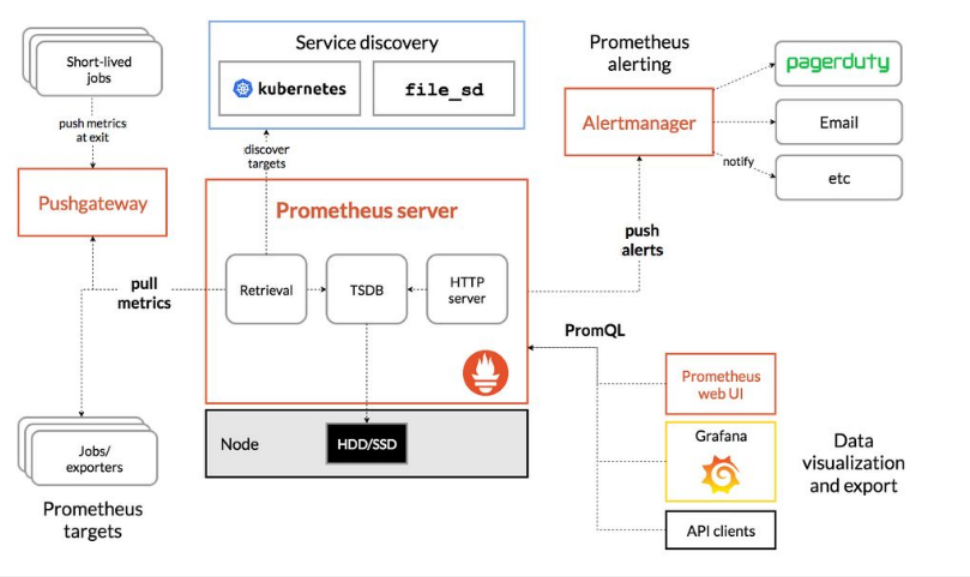
- 架构图
- 创建一个prom的名称空间
- prometheus安装分4个部分:
- 部署node-exporter
- 部署prometheus
- 部署日志转换工具kube-state-metrics
- 部署k8s-prometheus-adapter
- 生成证书及secret资源
- 创建一个apiserver: v1beta1.custom.metrics.k8s.io
- 创建一个用户为custom-metrics-apiserver所在名称空间为prom
- 创建一个ClusterRoleBinding给用户custom-metrics-apiserver授于system:auth-delegator的权限
- 创建一个RoleBinding给用户custom-metrics-apiserver授于extension-apiserver-authentication-reader的权限
- 创建一个ClusterRole名字为custom-metrics-resource-reader
- 创建一个 ClusterRoleBinding给用户 custom-metrics-apiserver授于 custom-metrics-resource-reader的权限
- 创建一个deployment和svc资源
- grafana进行数据展示

架构图
创建一个prom的名称空间
cat > namespace.yaml << EOFapiVersion: v1kind: Namespacemetadata:name: promEOFkubectl create -f namespace.yaml
prometheus安装分4个部分:
部署node-exporter
此组件是prometheus的客户端,主要负责收集日志信息
cat > node-exporter-ds.yaml << EOF
apiVersion: apps/v1
kind: DaemonSet
metadata:
  name: prometheus-node-exporter
  namespace: prom
  labels:
    app: prometheus
    component: node-exporter
spec:
  selector:
    matchLabels:
      app: prometheus
      component: node-exporter
  template:
    metadata:
      name: prometheus-node-exporter
      labels:
        app: prometheus
        component: node-exporter
    spec:
      tolerations:
      - effect: NoSchedule
        key: node-role.kubernetes.io/master
      containers:
      - image: prom/node-exporter:v0.15.2
        name: prometheus-node-exporter
        ports:
        - name: prom-node-exp
          containerPort: 9100
          hostPort: 9100
      hostNetwork: true
      hostPID: true
---
apiVersion: v1
kind: Service
metadata:
  annotations:
    prometheus.io/scrape: 'true'
  name: prometheus-node-exporter
  namespace: prom
  labels:
    app: prometheus
    component: node-exporter
spec:
  clusterIP: None
  ports:
    - name: prometheus-node-exporter
      port: 9100
      protocol: TCP
  selector:
    app: prometheus
    component: node-exporter
  type: ClusterIP
EOF
kubectl create -f node-exporter-ds.yaml
检查资源是否创建成功
kubectl get all -n prom
部署prometheus
创建一个configmap资源
cat prometheus-configmap.yaml
kind: ConfigMap
apiVersion: v1
metadata:
  labels:
    app: prometheus
  name: prometheus-config
  namespace: prom
data:
  prometheus.yml: |
    # A scrape configuration for running Prometheus on a Kubernetes cluster.
    # This uses separate scrape configs for cluster components (i.e. API server, node)
    # and services to allow each to use different authentication configs.
    #
    # Kubernetes labels will be added as Prometheus labels on metrics via the
    # `labelmap` relabeling action.
    #
    # If you are using Kubernetes 1.7.2 or earlier, please take note of the comments
    # for the kubernetes-cadvisor job; you will need to edit or remove this job.

    # Scrape config for API servers.
    #
    # Kubernetes exposes API servers as endpoints to the default/kubernetes
    # service so this uses `endpoints` role and uses relabelling to only keep
    # the endpoints associated with the default/kubernetes service using the
    # default named port `https`. This works for single API server deployments as
    # well as HA API server deployments.
    global:
      scrape_interval: 15s
      scrape_timeout: 10s
      evaluation_interval: 1m

    scrape_configs:
    - job_name: 'kubernetes-apiservers'

      kubernetes_sd_configs:
      - role: endpoints

      # Default to scraping over https. If required, just disable this or change to
      # `http`.
      scheme: https

      # This TLS & bearer token file config is used to connect to the actual scrape
      # endpoints for cluster components. This is separate to discovery auth
      # configuration because discovery & scraping are two separate concerns in
      # Prometheus. The discovery auth config is automatic if Prometheus runs inside
      # the cluster. Otherwise, more config options have to be provided within the
      # <kubernetes_sd_config>.
      tls_config:
        ca_file: /var/run/secrets/kubernetes.io/serviceaccount/ca.crt
        # If your node certificates are self-signed or use a different CA to the
        # master CA, then disable certificate verification below. Note that
        # certificate verification is an integral part of a secure infrastructure
        # so this should only be disabled in a controlled environment. You can
        # disable certificate verification by uncommenting the line below.
        #
        # insecure_skip_verify: true
      bearer_token_file: /var/run/secrets/kubernetes.io/serviceaccount/token

      # Keep only the default/kubernetes service endpoints for the https port. This
      # will add targets for each API server which Kubernetes adds an endpoint to
      # the default/kubernetes service.
      relabel_configs:
      - source_labels: [__meta_kubernetes_namespace, __meta_kubernetes_service_name, __meta_kubernetes_endpoint_port_name]
        action: keep
        regex: default;kubernetes;https

    # Scrape config for nodes (kubelet).
    #
    # Rather than connecting directly to the node, the scrape is proxied though the
    # Kubernetes apiserver.  This means it will work if Prometheus is running out of
    # cluster, or can't connect to nodes for some other reason (e.g. because of
    # firewalling).
    - job_name: 'kubernetes-nodes'

      # Default to scraping over https. If required, just disable this or change to
      # `http`.
      scheme: https

      # This TLS & bearer token file config is used to connect to the actual scrape
      # endpoints for cluster components. This is separate to discovery auth
      # configuration because discovery & scraping are two separate concerns in
      # Prometheus. The discovery auth config is automatic if Prometheus runs inside
      # the cluster. Otherwise, more config options have to be provided within the
      # <kubernetes_sd_config>.
      tls_config:
        ca_file: /var/run/secrets/kubernetes.io/serviceaccount/ca.crt
      bearer_token_file: /var/run/secrets/kubernetes.io/serviceaccount/token

      kubernetes_sd_configs:
      - role: node

      relabel_configs:
      - action: labelmap
        regex: __meta_kubernetes_node_label_(.+)
      - target_label: __address__
        replacement: kubernetes.default.svc:443
      - source_labels: [__meta_kubernetes_node_name]
        regex: (.+)
        target_label: __metrics_path__
        replacement: /api/v1/nodes/${1}/proxy/metrics

    # Scrape config for Kubelet cAdvisor.
    #
    # This is required for Kubernetes 1.7.3 and later, where cAdvisor metrics
    # (those whose names begin with 'container_') have been removed from the
    # Kubelet metrics endpoint.  This job scrapes the cAdvisor endpoint to
    # retrieve those metrics.
    #
    # In Kubernetes 1.7.0-1.7.2, these metrics are only exposed on the cAdvisor
    # HTTP endpoint; use "replacement: /api/v1/nodes/${1}:4194/proxy/metrics"
    # in that case (and ensure cAdvisor's HTTP server hasn't been disabled with
    # the --cadvisor-port=0 Kubelet flag).
    #
    # This job is not necessary and should be removed in Kubernetes 1.6 and
    # earlier versions, or it will cause the metrics to be scraped twice.
    - job_name: 'kubernetes-cadvisor'

      # Default to scraping over https. If required, just disable this or change to
      # `http`.
      scheme: https

      # This TLS & bearer token file config is used to connect to the actual scrape
      # endpoints for cluster components. This is separate to discovery auth
      # configuration because discovery & scraping are two separate concerns in
      # Prometheus. The discovery auth config is automatic if Prometheus runs inside
      # the cluster. Otherwise, more config options have to be provided within the
      # <kubernetes_sd_config>.
      tls_config:
        ca_file: /var/run/secrets/kubernetes.io/serviceaccount/ca.crt
      bearer_token_file: /var/run/secrets/kubernetes.io/serviceaccount/token

      kubernetes_sd_configs:
      - role: node

      relabel_configs:
      - action: labelmap
        regex: __meta_kubernetes_node_label_(.+)
      - target_label: __address__
        replacement: kubernetes.default.svc:443
      - source_labels: [__meta_kubernetes_node_name]
        regex: (.+)
        target_label: __metrics_path__
        replacement: /api/v1/nodes/${1}/proxy/metrics/cadvisor

    # Scrape config for service endpoints.
    #
    # The relabeling allows the actual service scrape endpoint to be configured
    # via the following annotations:
    #
    # * `prometheus.io/scrape`: Only scrape services that have a value of `true`
    # * `prometheus.io/scheme`: If the metrics endpoint is secured then you will need
    # to set this to `https` & most likely set the `tls_config` of the scrape config.
    # * `prometheus.io/path`: If the metrics path is not `/metrics` override this.
    # * `prometheus.io/port`: If the metrics are exposed on a different port to the
    # service then set this appropriately.
    - job_name: 'kubernetes-service-endpoints'

      kubernetes_sd_configs:
      - role: endpoints

      relabel_configs:
      - source_labels: [__meta_kubernetes_service_annotation_prometheus_io_scrape]
        action: keep
        regex: true
      - source_labels: [__meta_kubernetes_service_annotation_prometheus_io_scheme]
        action: replace
        target_label: __scheme__
        regex: (https?)
      - source_labels: [__meta_kubernetes_service_annotation_prometheus_io_path]
        action: replace
        target_label: __metrics_path__
        regex: (.+)
      - source_labels: [__address__, __meta_kubernetes_service_annotation_prometheus_io_port]
        action: replace
        target_label: __address__
        regex: ([^:]+)(?::\d+)?;(\d+)
        replacement: $1:$2
      - action: labelmap
        regex: __meta_kubernetes_service_label_(.+)
      - source_labels: [__meta_kubernetes_namespace]
        action: replace
        target_label: kubernetes_namespace
      - source_labels: [__meta_kubernetes_service_name]
        action: replace
        target_label: kubernetes_name

    # Example scrape config for pods
    #
    # The relabeling allows the actual pod scrape endpoint to be configured via the
    # following annotations:
    #
    # * `prometheus.io/scrape`: Only scrape pods that have a value of `true`
    # * `prometheus.io/path`: If the metrics path is not `/metrics` override this.
    # * `prometheus.io/port`: Scrape the pod on the indicated port instead of the
    # pod's declared ports (default is a port-free target if none are declared).
    - job_name: 'kubernetes-pods'
      # if you want to use metrics on jobs, set the below field to
      # true to prevent Prometheus from setting the `job` label
      # automatically.
      honor_labels: false
      kubernetes_sd_configs:
      - role: pod
      # skip verification so you can do HTTPS to pods
      tls_config:
        insecure_skip_verify: true
      # make sure your labels are in order
      relabel_configs:
      # these labels tell Prometheus to automatically attach source
      # pod and namespace information to each collected sample, so
      # that they'll be exposed in the custom metrics API automatically.
      - source_labels: [__meta_kubernetes_namespace]
        action: replace
        target_label: namespace
      - source_labels: [__meta_kubernetes_pod_name]
        action: replace
        target_label: pod
      # these labels tell Prometheus to look for
      # prometheus.io/{scrape,path,port} annotations to configure
      # how to scrape
      - source_labels: [__meta_kubernetes_pod_annotation_prometheus_io_scrape]
        action: keep
        regex: true
      - source_labels: [__meta_kubernetes_pod_annotation_prometheus_io_path]
        action: replace
        target_label: __metrics_path__
        regex: (.+)
      - source_labels: [__address__, __meta_kubernetes_pod_annotation_prometheus_io_port]
        action: replace
        regex: ([^:]+)(?::\d+)?;(\d+)
        replacement: $1:$2
        target_label: __address__
      - source_labels: [__meta_kubernetes_pod_annotation_prometheus_io_scheme]
        action: replace
        target_label: __scheme__
        regex: (.+)
创建ClusterRole,ServiceAccount,ClusterRoleBinding资源
cat > prometheus-rbac.yaml << EOF
apiVersion: rbac.authorization.k8s.io/v1beta1
kind: ClusterRole
metadata:
  name: prometheus
rules:
- apiGroups: [""]
  resources:
  - nodes
  - nodes/proxy
  - services
  - endpoints
  - pods
  verbs: ["get", "list", "watch"]
- apiGroups:
  - extensions
  resources:
  - ingresses
  verbs: ["get", "list", "watch"]
- nonResourceURLs: ["/metrics"]
  verbs: ["get"]
---
apiVersion: v1
kind: ServiceAccount
metadata:
  name: prometheus
  namespace: prom
---
apiVersion: rbac.authorization.k8s.io/v1beta1
kind: ClusterRoleBinding
metadata:
  name: prometheus
roleRef:
  apiGroup: rbac.authorization.k8s.io
  kind: ClusterRole
  name: prometheus
subjects:
- kind: ServiceAccount
  name: prometheus
  namespace: prom
EOF
kubectl create -f prometheus-rbac.yaml
#注意检查资源生成情况,确保每一步正常,方便排错
kubectl get all -n prom
创建Deployment资源
cat > prometheus-deploy.yaml << EOF
apiVersion: apps/v1
kind: Deployment
metadata:
  name: prometheus-server
  namespace: prom
  labels:
    app: prometheus
spec:
  replicas: 1
  selector:
    matchLabels:
      app: prometheus
      component: server
    #matchExpressions:
    #- {key: app, operator: In, values: [prometheus]}
    #- {key: component, operator: In, values: [server]}
  template:
    metadata:
      labels:
        app: prometheus
        component: server
      annotations:
        prometheus.io/scrape: 'false'
    spec:
      serviceAccountName: prometheus
      containers:
      - name: prometheus
        image: prom/prometheus:v2.2.1
        imagePullPolicy: IfNotPresent
        command:
          - prometheus
          - --config.file=/etc/prometheus/prometheus.yml
          - --storage.tsdb.path=/prometheus
          - --storage.tsdb.retention=720h
        ports:
        - containerPort: 9090
          protocol: TCP
        resources:
          limits:
            memory: 2Gi
        volumeMounts:
        - mountPath: /etc/prometheus/prometheus.yml
          name: prometheus-config
          subPath: prometheus.yml
        - mountPath: /prometheus/
          name: prometheus-storage-volume
      volumes:
        - name: prometheus-config
          configMap:
            name: prometheus-config
            items:
              - key: prometheus.yml
                path: prometheus.yml
                mode: 0644
        - name: prometheus-storage-volume
          emptyDir: {}
EOF
kubectl create -f prometheus-deploy.yaml
#注意检查资源生成情况,确保每一步正常,方便排错
kubectl get all -n prom
#工作中不要使用空目录进行数据存放,使用nfs或pvc.
创建svc资源,暴露外部访问端口
cat > prometheus-svc.yaml << EOF
apiVersion: v1
kind: Service
metadata:
  name: prometheus
  namespace: prom
  labels:
    app: prometheus
spec:
  type: NodePort
  ports:
    - port: 9090
      targetPort: 9090
      nodePort: 30090
      protocol: TCP
  selector:
    app: prometheus
    component: server
EOF
kubectl create -f prometheus-svc.yaml
部署日志转换工具kube-state-metrics
创建ClusterRole,ServiceAccount,ClusterRoleBinding资源
cat > kube-state-metrics-rbac.yaml << EOF
---
apiVersion: v1
kind: ServiceAccount
metadata:
  name: kube-state-metrics
  namespace: prom
---
apiVersion: rbac.authorization.k8s.io/v1
kind: ClusterRole
metadata:
  name: kube-state-metrics
rules:
- apiGroups: [""]
  resources: ["nodes", "pods", "services", "resourcequotas", "replicationcontrollers", "limitranges", "persistentvolumeclaims", "persistentvolumes", "namespaces", "endpoints"]
  verbs: ["list", "watch"]
- apiGroups: ["extensions"]
  resources: ["daemonsets", "deployments", "replicasets"]
  verbs: ["list", "watch"]
- apiGroups: ["apps"]
  resources: ["statefulsets"]
  verbs: ["list", "watch"]
- apiGroups: ["batch"]
  resources: ["cronjobs", "jobs"]
  verbs: ["list", "watch"]
- apiGroups: ["autoscaling"]
  resources: ["horizontalpodautoscalers"]
  verbs: ["list", "watch"]
---
apiVersion: rbac.authorization.k8s.io/v1
kind: ClusterRoleBinding
metadata:
  name: kube-state-metrics
roleRef:
  apiGroup: rbac.authorization.k8s.io
  kind: ClusterRole
  name: kube-state-metrics
subjects:
- kind: ServiceAccount
  name: kube-state-metrics
  namespace: prom
EOF
kubectl create -f kube-state-metrics-rbac.yaml
创建Deployment资源
cat > kube-state-metrics-deploy.yaml << EOF
apiVersion: apps/v1
kind: Deployment
metadata:
  name: kube-state-metrics
  namespace: prom
spec:
  replicas: 1
  selector:
    matchLabels:
      app: kube-state-metrics
  template:
    metadata:
      labels:
        app: kube-state-metrics
    spec:
      serviceAccountName: kube-state-metrics
      containers:
      - name: kube-state-metrics
        image: 10.0.0.70:5000/kube-state-metrics-amd64:v1.3.1
        ports:
        - containerPort: 8080
EOF
kubectl create -f kube-state-metrics-deploy.yaml
#注意检查资源生成情况,确保每一步正常,方便排错
kubectl get all -n prom
#下面附一个kube-state-metrics镜像.
gcr-io-google_containers-kube-state-metrics-amd64v1-3-1.tar
创建svc资源
cat > kube-state-metrics-svc.yaml << EOF
apiVersion: v1
kind: Service
metadata:
  annotations:
    prometheus.io/scrape: 'true'
  name: kube-state-metrics
  namespace: prom
  labels:
    app: kube-state-metrics
spec:
  ports:
  - name: kube-state-metrics
    port: 8080
    protocol: TCP
  selector:
    app: kube-state-metrics
EOF
kubectl create -f kube-state-metrics-svc.yaml
部署k8s-prometheus-adapter
生成证书及secret资源
cd /etc/kubernetes/pki
(umask 077;openssl genrsa -out serving.key 2048)
openssl req -new -key serving.key -out serving.csr -subj "/CN=serving"
openssl x509 -req -in serving.csr -CA ./ca.crt -CAkey ./ca.key -CAcreateserial -out serving.crt -days 3650
kubectl create secret generic cm-adapter-serving-certs --from-file=serving.crt=./serving.crt --from-file=serving.key=./serving.key -n prom
创建一个apiserver: v1beta1.custom.metrics.k8s.io
cat > custom-metrics-apiservice.yaml << EOF
apiVersion: apiregistration.k8s.io/v1beta1
kind: APIService
metadata:
  name: v1beta1.custom.metrics.k8s.io
spec:
  service:
    name: custom-metrics-apiserver
    namespace: prom
  group: custom.metrics.k8s.io
  version: v1beta1
  insecureSkipTLSVerify: true
  groupPriorityMinimum: 100
  versionPriority: 100
EOF
kubectl create -f custom-metrics-apiservice.yaml
#查看apiserver:
kubectl api-versions
创建一个用户为custom-metrics-apiserver所在名称空间为prom
cat > custom-metrics-apiserver-service-account.yaml << EOF
kind: ServiceAccount
apiVersion: v1
metadata:
  name: custom-metrics-apiserver
  namespace: prom
EOF
kubectl create -f custom-metrics-apiserver-service-account.yaml
创建一个ClusterRoleBinding给用户custom-metrics-apiserver授于system:auth-delegator的权限
cat > custom-metrics-apiserver-auth-delegator-cluster-role-binding.yaml << EOF
apiVersion: rbac.authorization.k8s.io/v1
kind: ClusterRoleBinding
metadata:
  name: custom-metrics:system:auth-delegator
roleRef:
  apiGroup: rbac.authorization.k8s.io
  kind: ClusterRole
  name: system:auth-delegator
subjects:
- kind: ServiceAccount
  name: custom-metrics-apiserver
  namespace: prom
EOF
kubectl create -f custom-metrics-apiserver-auth-delegator-cluster-role-binding.yaml
创建一个RoleBinding给用户custom-metrics-apiserver授于extension-apiserver-authentication-reader的权限
cat > custom-metrics-apiserver-auth-reader-role-binding.yaml << EOF
apiVersion: rbac.authorization.k8s.io/v1
kind: RoleBinding
metadata:
  name: custom-metrics-auth-reader
  namespace: kube-system
roleRef:
  apiGroup: rbac.authorization.k8s.io
  kind: Role
  name: extension-apiserver-authentication-reader
subjects:
- kind: ServiceAccount
  name: custom-metrics-apiserver
  namespace: prom
EOF
kubectl create -f custom-metrics-apiserver-auth-reader-role-binding.yaml
创建一个ClusterRole名字为custom-metrics-resource-reader
cat custom-metrics-resource-reader-cluster-role.yaml
apiVersion: rbac.authorization.k8s.io/v1
kind: ClusterRole
metadata:
  name: custom-metrics-resource-reader
rules:
- apiGroups:
  - ""
  resources:
  - namespaces
  - pods
  - services
  verbs:
  - get
  - list
创建一个 ClusterRoleBinding给用户 custom-metrics-apiserver授于 custom-metrics-resource-reader的权限
cat > custom-metrics-apiserver-resource-reader-cluster-role-binding.yaml << EOF
apiVersion: rbac.authorization.k8s.io/v1
kind: ClusterRoleBinding
metadata:
  name: custom-metrics-resource-reader
roleRef:
  apiGroup: rbac.authorization.k8s.io
  kind: ClusterRole
  name: custom-metrics-resource-reader
subjects:
- kind: ServiceAccount
  name: custom-metrics-apiserver
  namespace: prom
EOF
kubectl create -f custom-metrics-apiserver-resource-reader-cluster-role-binding.yaml
创建一个deployment和svc资源
cat > custom-metrics-apiserver-deployment.yaml << EOF
apiVersion: apps/v1
kind: Deployment
metadata:
  labels:
    app: custom-metrics-apiserver
  name: custom-metrics-apiserver
  namespace: prom
spec:
  replicas: 1
  selector:
    matchLabels:
      app: custom-metrics-apiserver
  template:
    metadata:
      labels:
        app: custom-metrics-apiserver
      name: custom-metrics-apiserver
    spec:
      serviceAccountName: custom-metrics-apiserver
      containers:
      - name: custom-metrics-apiserver
        image: 10.0.0.70:5000/k8s-prometheus-adapter-amd64:latest
        imagePullPolicy: IfNotPresent
        args:
        - --secure-port=6443
        - --tls-cert-file=/var/run/serving-cert/serving.crt
        - --tls-private-key-file=/var/run/serving-cert/serving.key
        - --logtostderr=true
        - --prometheus-url=http://prometheus.prom.svc:9090/
        - --metrics-relist-interval=1m
        - --v=10
        - --config=/etc/adapter/config.yaml
        ports:
        - containerPort: 6443
        volumeMounts:
        - mountPath: /var/run/serving-cert
          name: volume-serving-cert
          readOnly: true
        - mountPath: /etc/adapter/
          name: config
          readOnly: true
        - mountPath: /tmp
          name: tmp-vol
      volumes:
      - name: volume-serving-cert
        secret:
          secretName: cm-adapter-serving-certs
      - name: config
        configMap:
          name: adapter-config
      - name: tmp-vol
        emptyDir: {}
EOF
kubectl create -f custom-metrics-apiserver-deployment.yaml
#注意检查资源生成情况,确保每一步正常,方便排错
kubectl get all -n prom
#工作中不要使用空目录进行数据存放,使用nfs或pvc.
directxman12-k8s-prometheus-adapter-amd64-latest.tar
grafana进行数据展示
创建一个ClusterRole名字为custom-metrics-server-resources
cat > custom-metrics-cluster-role.yaml << EOF
apiVersion: rbac.authorization.k8s.io/v1
kind: ClusterRole
metadata:
  name: custom-metrics-server-resources
rules:
- apiGroups:
  - custom.metrics.k8s.io
  resources: ["*"]
  verbs: ["*"]
EOF
kubectl create -f custom-metrics-cluster-role.yaml
创建一个ClusterRoleBinding让用户horizontal-pod-autoscaler具有custom-metrics-server-resources的权限
cat > hpa-custom-metrics-cluster-role-binding.yaml << EOF
apiVersion: rbac.authorization.k8s.io/v1
kind: ClusterRoleBinding
metadata:
  name: hpa-controller-custom-metrics
roleRef:
  apiGroup: rbac.authorization.k8s.io
  kind: ClusterRole
  name: custom-metrics-server-resources
subjects:
- kind: ServiceAccount
  name: horizontal-pod-autoscaler
  namespace: kube-system
EOF
kubectl create -f hpa-custom-metrics-cluster-role-binding.yaml
创建一个deployment和svc资源
cat > grafana.yaml << EOF
apiVersion: extensions/v1beta1
kind: Deployment
metadata:
  name: monitoring-grafana
  namespace: prom
spec:
  replicas: 1
  template:
    metadata:
      labels:
        task: monitoring
        k8s-app: grafana
    spec:
      containers:
      - name: grafana
        image: 10.0.0.70:5000/heapster-grafana-amd64:v5.0.4
        ports:
        - containerPort: 3000
          protocol: TCP
        volumeMounts:
        - mountPath: /etc/ssl/certs
          name: ca-certificates
          readOnly: true
        - mountPath: /var
          name: grafana-storage
        env:
       # - name: INFLUXDB_HOST
       #   value: monitoring-influxdb
        - name: GF_SERVER_HTTP_PORT
          value: "3000"
          # The following env variables are required to make Grafana accessible via
          # the kubernetes api-server proxy. On production clusters, we recommend
          # removing these env variables, setup auth for grafana, and expose the grafana
          # service using a LoadBalancer or a public IP.
        - name: GF_AUTH_BASIC_ENABLED
          value: "false"
        - name: GF_AUTH_ANONYMOUS_ENABLED
          value: "true"
        - name: GF_AUTH_ANONYMOUS_ORG_ROLE
          value: Admin
        - name: GF_SERVER_ROOT_URL
          # If you're only using the API Server proxy, set this value instead:
          # value: /api/v1/namespaces/kube-system/services/monitoring-grafana/proxy
          value: /
      volumes:
      - name: ca-certificates
        hostPath:
          path: /etc/ssl/certs
      - name: grafana-storage
        emptyDir: {}
---
apiVersion: v1
kind: Service
metadata:
  labels:
    # For use as a Cluster add-on (https://github.com/kubernetes/kubernetes/tree/master/cluster/addons)
    # If you are NOT using this as an addon, you should comment out this line.
    kubernetes.io/cluster-service: 'true'
    kubernetes.io/name: monitoring-grafana
  name: monitoring-grafana
  namespace: prom
spec:
  # In a production setup, we recommend accessing Grafana through an external Loadbalancer
  # or through a public IP.
  # type: LoadBalancer
  # You could also use NodePort to expose the service at a randomly-generated port
  # type: NodePort
  ports:
  - port: 80
    targetPort: 3000
    nodePort: 30000
  selector:
    k8s-app: grafana
  type: NodePort
EOF
kubectl create -f grafana.yaml
浏览器访问http://10.0.0.70:30000
配置grafana的数据源

导入监控模板,可以下载json文件
模板下载地址:https://grafana.com/grafana/dashboards
导入json文件**


**

若有收获,就点个赞吧
0 人点赞
